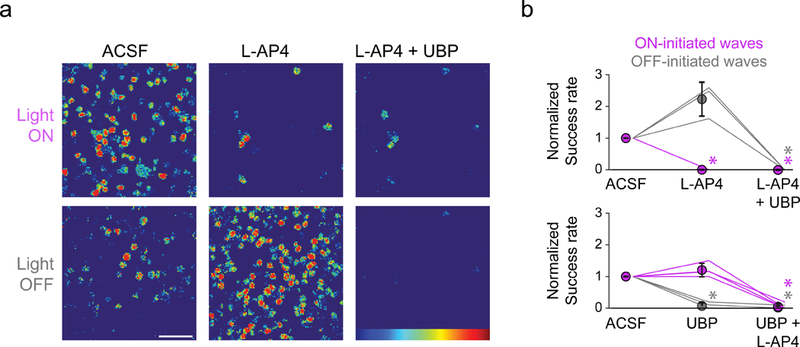
Figure 2. Blocking photoreceptor to bipolar cell signaling abolishes light-evoked wave initiation.

a. Heatmaps representing ∆F/F of example RGC responses to light onset and offset in ACSF (left), L-AP4 (middle), and L-AP4+UBP 310 (right). Note ipRGC responses are preserved during light onset in presence of photoreceptor-bipolar cell antagonists (top right). Scale bar = 50 µm.
b. Light modulates the frequency of glutamatergic waves via activation of conventional photoreceptors. Top: Summary data depicting mean success rate of starting a wave on either the onset or offset of a light stimulus. n = 3 retinas per group. Bottom: Same as top but the order of the drugs was switched. n = 4 retinas per group. Error bars, SD. *p < 0.05 Dunn-Sidak.
