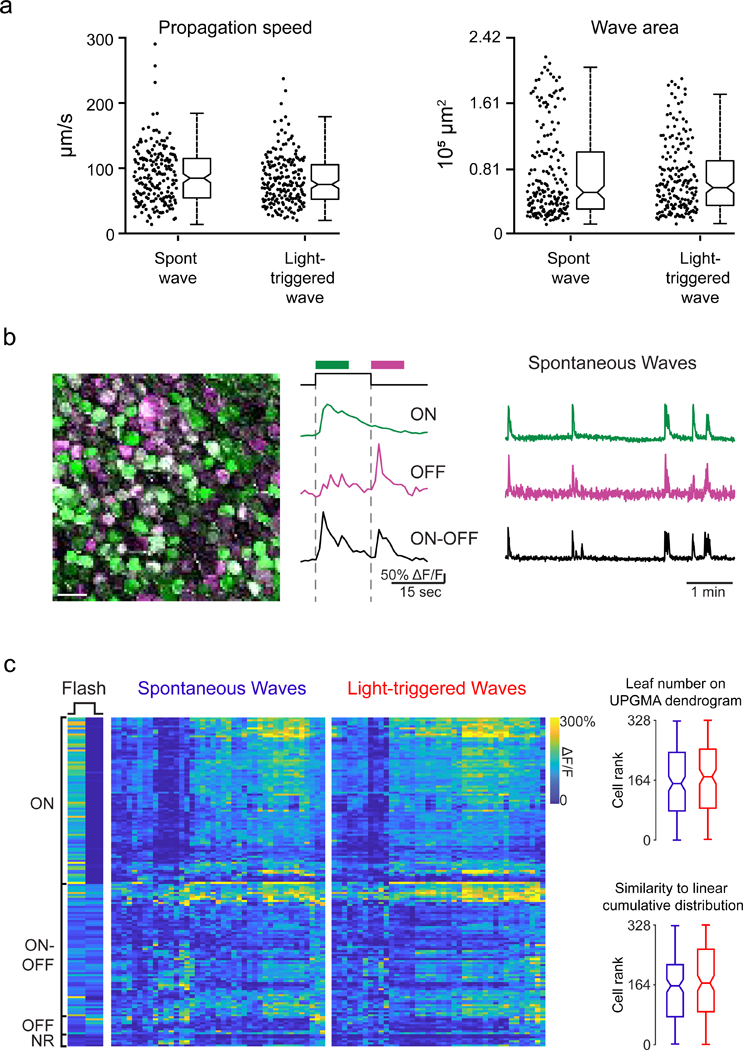
Figure 3. Light-triggered and spontaneous waves have similar spatiotemporal properties and recruit the same retinal circuits.

a. Summary data depicting wave propagation speed and wave propagation area for spontaneous and light-evoked waves. Notches: 95% CI.
b. Left: Pseudocolored representation of 164 RGCs responding to light onset (ON; green), light offset (OFF; magenta) or both (ON-OFF; white). Colored traces are example ∆F/F responses of individual RGCs to the flash of light. Right: example traces of spontaneous activity over 5 minutes for the same cells. Scale bar = 30 µm.
c. Left: RGCs were characterized by their light response (NR = no light response). Middle: Heatmap depicting max intensity of an RGC ∆F/F response (row) during each spontaneous and light-triggered wave (column). The rows are ordered based on light response. The columns are ordered based on similarity between waves. Right: Notched box plot representing leaf number distributions (top) or rank (bottom) of RGCs as they participate in spontaneous (blue) and light-triggered (red) waves. The leaf numbers come from a dendrogram that was generated using UPGMA hierarchical clustering of RGC activity profiles during spontaneous and light-triggered waves. Notches represent 95% CI. Rank is based on similarity to a model cell that responded equally to every wave. 0 is most similar.
