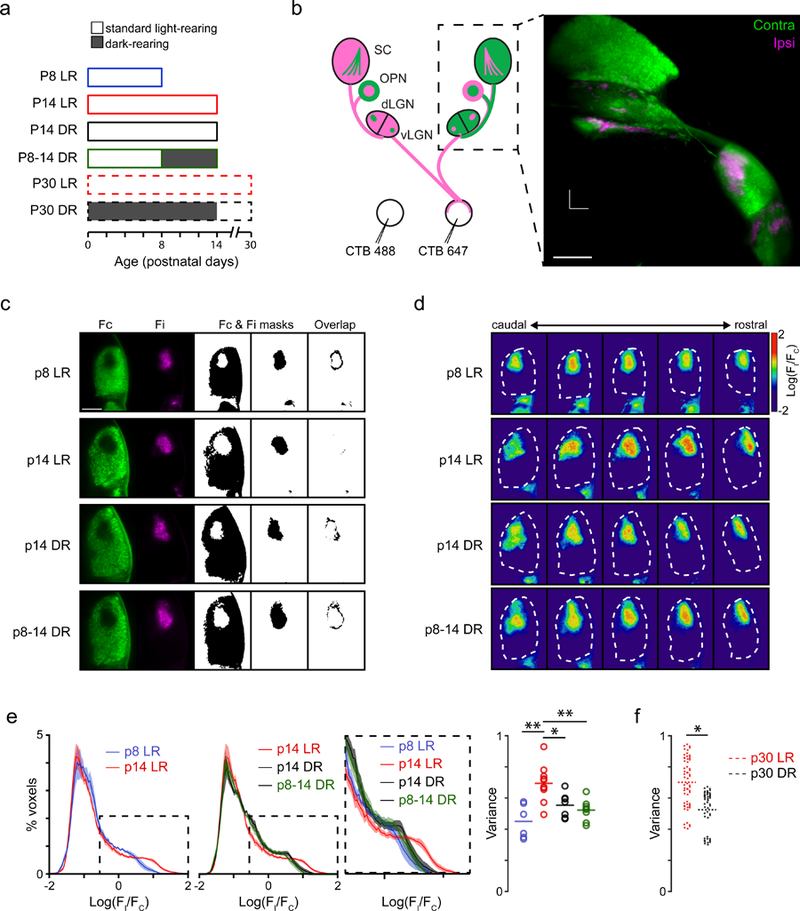
Figure 4. Mice reared in darkness before eye-opening exhibit reduced eye-specific segregation.

a. Schematic of experimental groups used in this study. LR: 12-hour day/night cycle; DR: dark-reared, 24-hour night cycle.
b. Left: Schematic representation of the experiment performed to investigate eye-specific segregation of retinal projections to multiple brain regions. Intraocular injection of anterograde tracers cholera toxin subunit B conjugated to Alexa 488 or Alexa 647 were used to visualize the retinal projections to the dorsal and ventral lateral geniculate nucleus (dLGN, vLGN), the olivary pretectal nucleus (OPN), and the superior colliculus (SC). Right: max intensity projection image of three-dimensional reconstruction of retinal projections to the vLGN, dLGN, OPN, and SC obtained by light-sheet imaging of cleared brains. Scale bar = 500 µm. See Supplementary Movies 2 and 3).
c. Optical coronal slices of the dLGN in P8 LR, P14 LR, P14 DR, and P8-P14 DR mice. First two columns are fluorescence images of retinal projections from the contralateral (green) and ipsilateral (magenta) eye. For display purposes, fluorescence is masked using a threshold (Fc and Fi masks; middle columns) and the overlap between the two is calculated (right).
d. Optical coronal slices depicting the log-ratio [log R = log10(Fi/Fc)] of ipsi-to-contralateral fluorescence across the anterior third section of the dLGN. Examples from the same brains as panel c.
e. Eye-specific segregation was represented by the distribution of the log-ratio (log R) of ipsi-to-contra fluorescence for all voxels within the dLGN. The positive values in the distribution represent voxels with greater ipsilateral fluorescence (e.g., see inset: increased segregation indicated by broader distribution). The variance of the distributions was used to compare across conditions (e.g. dotted lines indicate how less segregation would alter the distributions). Right: Summary data comparing variance of log R distributions across P8 LR, P14 LR, P14 DR, and P8-14 DR conditions. F(3,27) = 9.28, p = 0.0002; **: p < 0.01; *: p < 0.05 ANOVA followed by Tukey-Kramer post-hoc test.
f. Summary data comparing variance of log R distributions between p30 LR and p30 DR (dark-reared P0–14 and subsequently light-reared P15-P30). *: p < 0.05 unpaired t-test.
