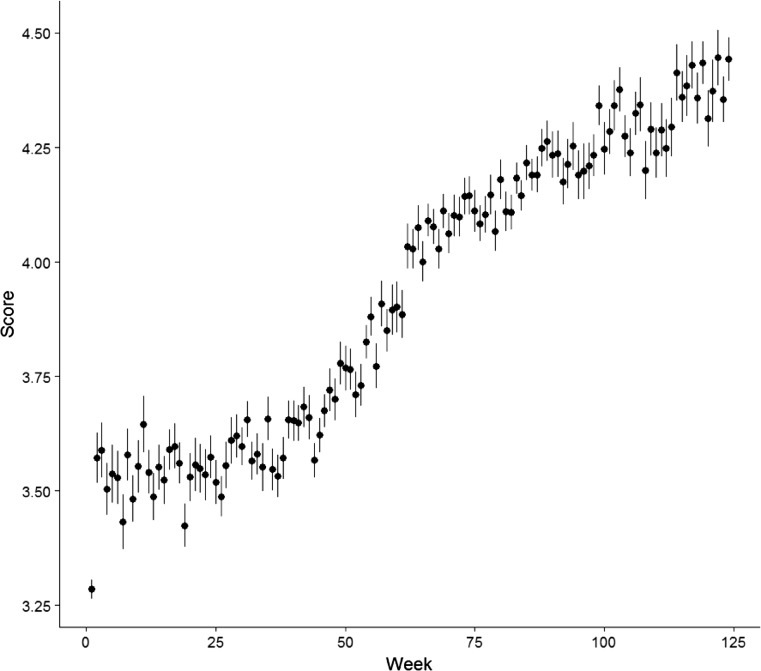
Fig. 2.
Development of performance (score) dependent of student. The Y‑axis represents the average score of students’ performance per week on a 5-point Likert-scale. The average score per week is collapsed per competency domain, per method and per student. The X‑axis represents 124 weeks of clinical training. The error bars represent the standard error (SE)

