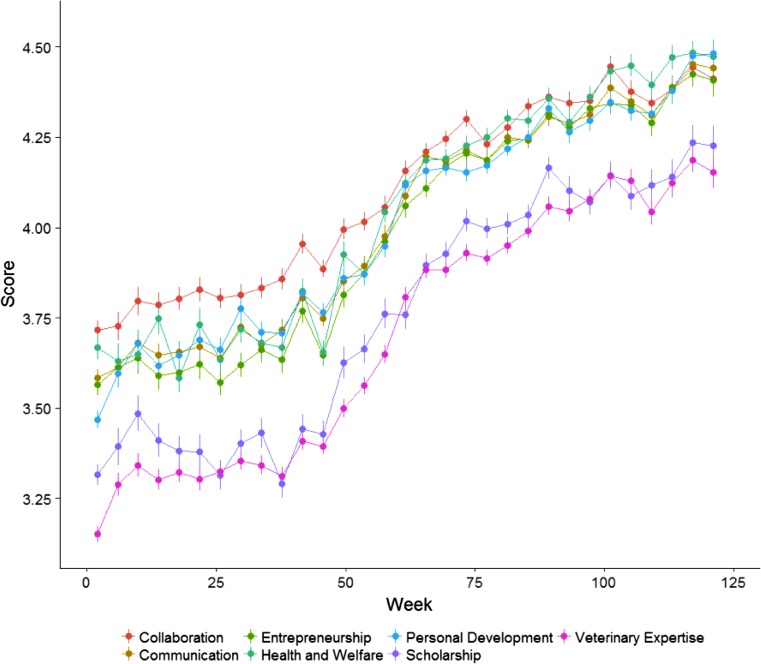
Fig. 3.
Average competency domain score (µ, se) within student across competency domain discretized by four weeks. Y‑axis represents the average score of students’ performance per competency domain on a 5-point Likert-scale. The average score is collapsed per method and per student. The error bars represent the standard error (SE)

