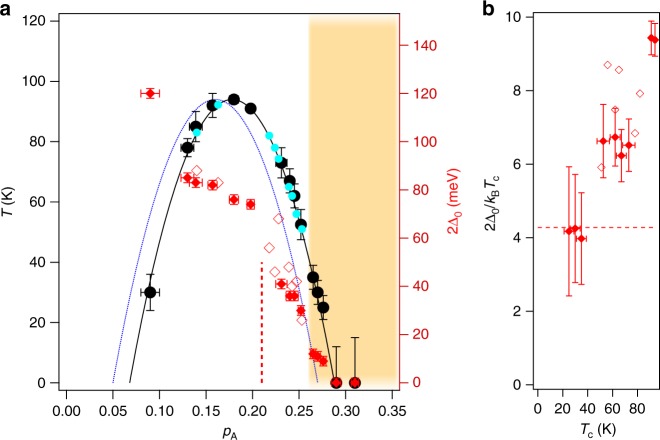
Fig. 3.
Phase diagram of Bi2Sr2CaCu2O8+δ. a Experimentally obtained superconducting transition temperature, Tc, (black circles) and the antinodal gap, 2Δ0 (solid red diamonds) are plotted versus experimentally determined doping parameter, pA. Also shown are gap values (open red diamonds) and Tc (turquoise circles) for different doping levels from several previously published studies5,31,32,34. These points are placed at the corresponding pA in accordance with our new Tc(pA) dependence. The universal superconducting dome is shown as blue dashed line, while the corrected dome is represented by black solid line. The red dashed line indicates the transition observed in SI-STM studies9. The shaded area marks the region that has not been studied before. Characteristic temperatures are displayed against the left axis, while the right axis is for the spectral gap. b Ratio of the antinodal gap and Tc for the points shown in a from the overdoped side. The red dashed line corresponds to the BCS value for d-wave gap. We have approximated the uncertainty in doping, ΔpA, (horizontal error bars in a) to be proportional to the width of the Fermi surface: ΔpA/pA ~ 2ΔkF/kF. The uncertainty in Tc is given by the width of superconducting transition in susceptibility measurements (underdoped samples), or by the temperature step size in T-dependent ARPES measurements that identify Tc (overdoped samples). The uncertainty in gap magnitude (red vertical error bars in a) corresponds to the standard deviation of the quasiparticle peak position determined from fitting. It serves to determine the propagated uncertainty (vertical error bars) in b

