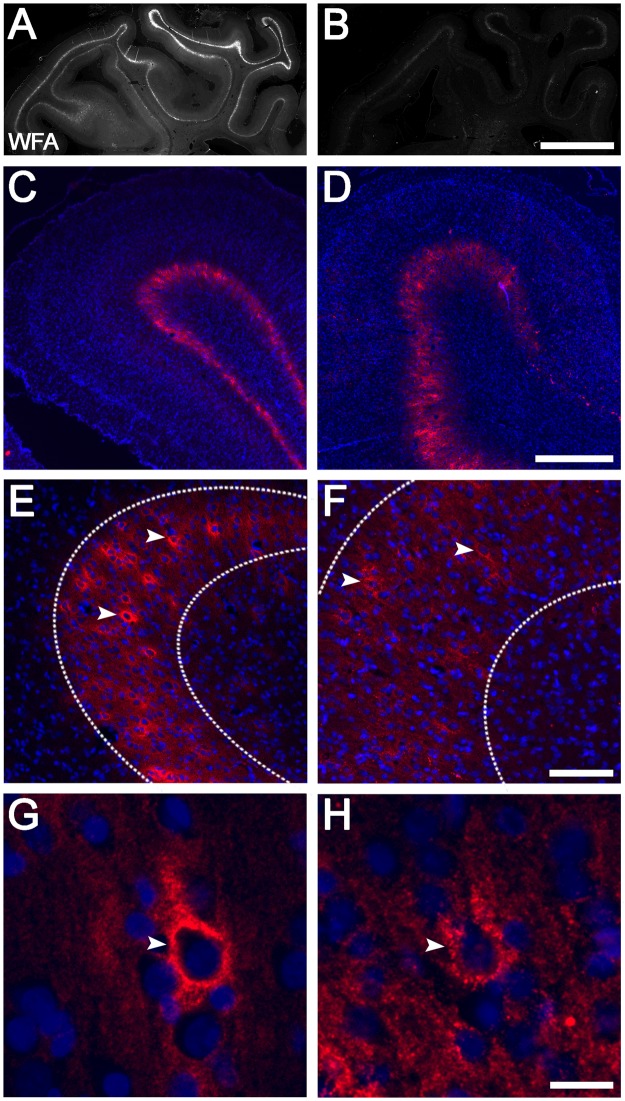
Figure 5.
Representative examples of PNNs in the parasagittal cortex of control and HI animals at 7 d recovery. Control (left column), HI (right column). WFA (A,B: grey, C–H: red), Hoechst 33258 (blue). Note that because of the marked reduction in WFA staining in HI animals, the image intensity of injured tissues (D,F,H) was manually adjusted (four-fold increase relative to control images) to allow visualisation of staining patterns. Representative examples of actual WFA staining levels between control and HI animals are shown in panels A and B. Images (C–H) were taken from PG1. Images (E–H) were taken from layer 6. Arrowheads indicate PNNs. The diffuse extracellular WFA staining is observed within layer 6 indicated by dotted lines. Scale bars: (A,B) 5 mm, (C, D) 500 µm, (E, F) 100 µm, (G, H) 20 µm.

