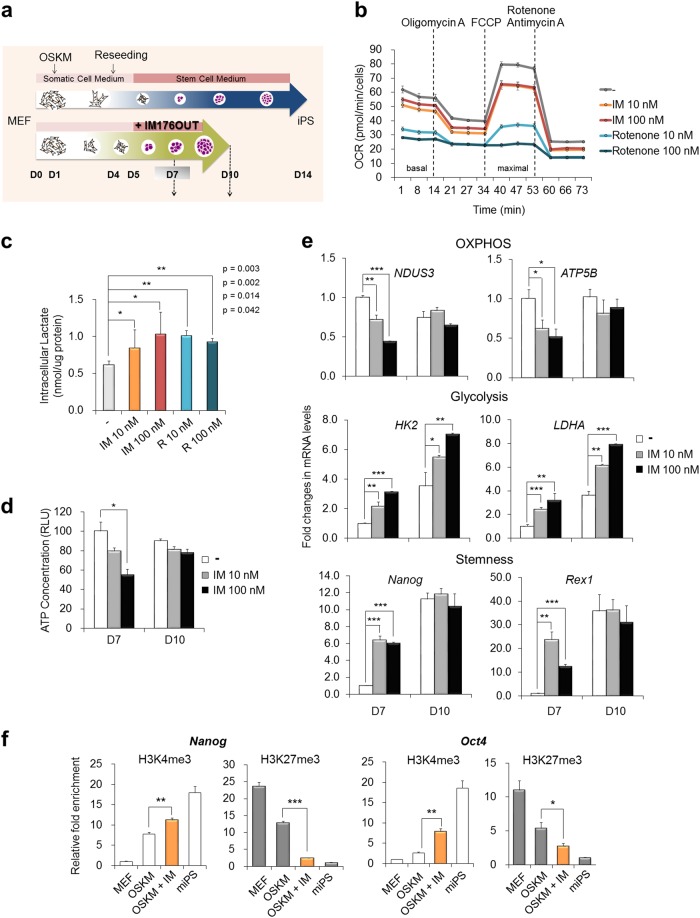
Fig. 2. IM inhibits mitochondrial OXPHOS and increases lactate production by inducing the expression of glycolysis- and pluripotency-related genes.
a Schematic diagram of the reprogramming process. b OSKM-transduced MEFs were reseeded in poly-l-lysine-coated 96-well XF plates on D4. On the following day (D5), the medium was replaced with mESC medium and each indicated chemical. After 2 days (D7), the OCR was measured using an XFe96 Flux analyzer. An ATP synthase inhibitor (1.5 μM oligomycin, ETC complex V inhibitor), uncoupler (5 μM FCCP), and complex I inhibitor (0.5 μM rotenone) + complex III inhibitor (0.5 μM antimycin A) were sequentially added at each indicated time point. c Lactate production was measured in each treatment group on day 7 of reprogramming. d The ATP concentration was quantified in each treatment group on days 7 (D7) and 10 (D10) of reprogramming. e The expression of the indicated gene in each treatment group was measured using real-time PCR analysis on days 7 and 10 of reprogramming. β-Actin expression was used as an internal control. f ChIP assays were performed on day 7 of reprogramming with or without IM treatment. MEFs and miPSCs were used as negative/positive controls for each histone mark. Histone H3 lysine 4 trimethylation (H3K4me3) and lysine 27 trimethylation (H3K27me3) were precipitated, and the Nanog and Oct4 promoter loci were determined by real-time PCR. Input samples were used as a relative control. *p < 0.05; **p < 0.01; ***p < 0.001 (Student’s t-test)

