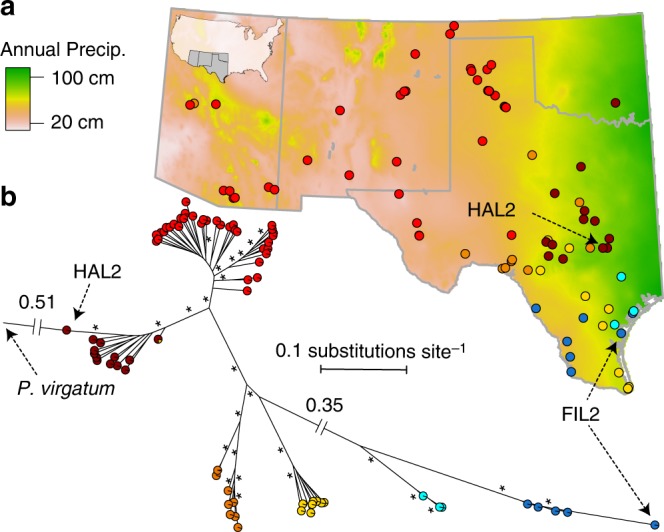
Fig. 1.

Genetic structure and geographic distribution of P. hallii. One individual was deeply re-sequenced from 94 locations across southwest USA (a). Filled points represent the geographic location of the population where each individual was collected. Point colors represent genetic subpopulation assignments from STRUCTURE. The map background is cropped from the annual precipitation (BIO12) 2.5-minute raster (http://worldclim.org/version2) via a 10-minute United States of American state-boundary vector shapefile (http://naturalearthdata.com). In addition to between-variety divergence (filipes: blue, hallii: red/orange/yellow), there was strong population structure within varieties (b); proportional subpopulation assignment is shown in pie charts at the branch tips. Branch lengths are proportional to the number of substitutions per variable site, except the root branch and the internal branch connecting varieties, which are labeled with the respective lengths; branches marked * have bootstrap support >90%. Source data are provided as a Source Data file
