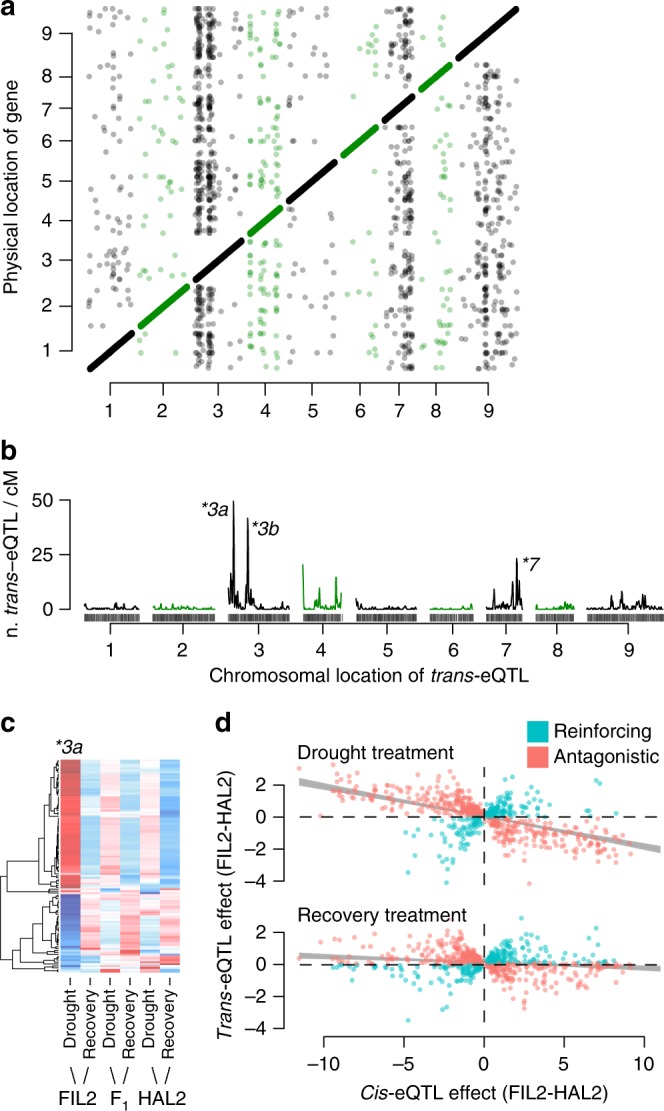
Fig. 3.

Distribution and effect of trans-eQTL. The position of each cis (on diagonal) and trans-eQTL (off diagonal) and the location of the proximate marker to the physical gene position are plotted (a). Points and line segments are colored green/black to distinguish adjacent chromosomes. The density of trans-eQTL/cM along sliding windows were scored across the genome (b). The three strongest peaks (hotspots) are labeled (*). The allelic effects of the *3a trans-eQTL are plotted as heatmaps, where red colors indicate higher gene-scaled expression (c). The color scale of the heatmap corresponds to the scaled allelic effects of the *3a hotspot, where increasing blue and red color intensity indicate stronger negative and positive allelic effects respectively. White cells have a scaled allelic effect of zero. We tested for biases of compensatory or reinforcing evolution between cis and trans eQTL. Overall, there was significant biases towards antagonistic effects, however this bias was much stronger in the drought than recovery treatment (d). Source data for panels a and d are found in Supplementary Table 8. Source data for panels b, c are provided as a Source Data file
