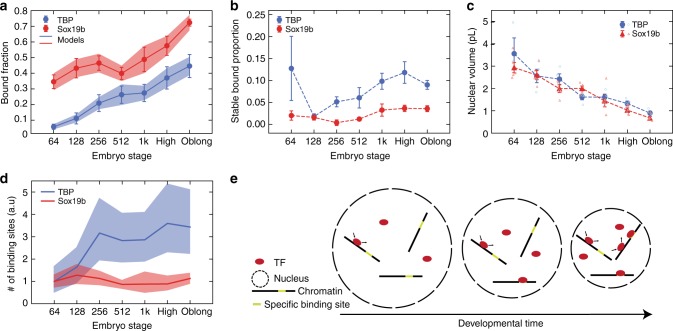
Fig. 5.
The chromatin-bound fractions of mEos2-TFs increase during early development. a Chromatin-bound fraction of mEos2-TBP (blue) and mEos2-Sox19b (red) during development (calculated from data presented in Fig. 4 and Supplementary Figure 11, mean ± s.e.m). Lines represent the chromatin-bound fraction as calculated from the law of mass action using data from b and c and extracting the apparent number of chromatin binding sites as free parameter. Shades represent error intervals propagated from the errors in stable bound proportion and nuclear volume. The panel includes in total 120572 molecules from 5 embryos (64-cell stage) and 6 embryos (later stages) for mEos2-TBP and 158912 molecules from 5 embryos for mEos2-Sox19b. b Stable bound proportion of chromatin-bound mEos2-TBP (blue) and mEos2-Sox19b (red) molecules during development (calculated from data presented in Fig. 4 and Supplementary Figure 11, mean ± s.e.m.). The panel includes in total 5677 molecules from 3 embryos (64-cell stage), 4 embryos (128-cell stage), 5 embryos (256-cell stage) and 6 embryos (later stages) for mEos2-TBP and 13103 molecules from 5 embryos for mEos2-Sox19b. The dashed line is given as guide to the eye. c Nuclear volume of mEos2-TBP (blue spheres) and mEos2-Sox19b (red triangles) injected embryos during development. Data includes 5, 16, 22, 25, 32, 37, 84 measurements from 3 embryos (64-cell stage) and 4 embryos (later stages) for mEos2-TBP and 17, 21, 33, 60, 42, 90, 98 measurements from 5 embryos for mEos2-Sox19b (mean ± s.e.m. mean values for single embryos shown as open circles for TBP and open triangles for Sox19b). The dashed line is given as guide to the eye. d Apparent number of chromatin binding sites of mEos2-TBP (blue) and mEos2-Sox19b (red) as calculated from the law of mass action using data from a, b, and c. Shades represent error intervals propagated from the errors in chromatin-bound fraction, stable bound proportion and nuclear volume. e Scheme of the concentration model. During early embryo development the size of individual nuclei decreases, thereby increasing the concentration of DNA and increasing the chromatin-bound fraction of TFs

