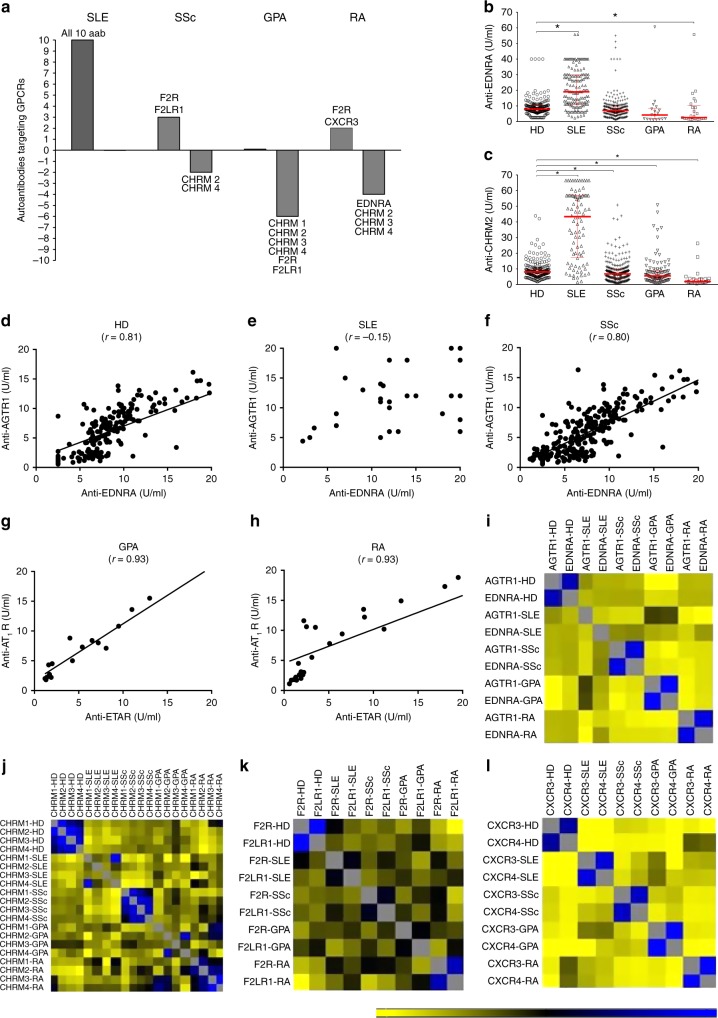
Fig. 1.
Relationships among autoantibodies in health and autoimmune diseases. a The graphic summarizes anti-GPCR autoantibodies (aab) in healthy donors (HD), which showed significantly increased or decreased concentrations when compared to those in the disease cohorts (systemic lupus erythematosus or SLE, systemic sclerosis or SSc, granulomatosis with polyangiitis or GPA, and rheumatoid arthritis or RA). Further details are shown in Supplementary Figure 1. The x-axis represents healthy controls. Graphics display concentrations of aab directed against b EDNRA and c CHRM2. The median with interquartile range is shown in red. *p ≤ 0.05 (Mann–Whitney test). Linear regression graphics exhibit the correlation between anti-EDNRA and anti-AGTR1 aab in sera from d HD, e SLE, f SSc, g GPA, and h RA. Heatmaps of aab vs. aab correlations demonstrate the spectrum of relationships among aab targeting i EDNRA and AGTR1; j CHRMs; k F2R and FLR1; and l CXCR3 and CXCR4 (for nomenclature, see Supplementary Table 2, aab dataset 1). The bar ranging from yellow to blue (−0.3 to 1) represents negative to positive correlations, respectively. In the correlation matrix, each small square represents a pairwise correlation between aab, as exemplified by d–h. The correlation matrices used to perform the hierarchical correlograms shown in Fig. 1i–l are provided as source data

