
Fig. 4.
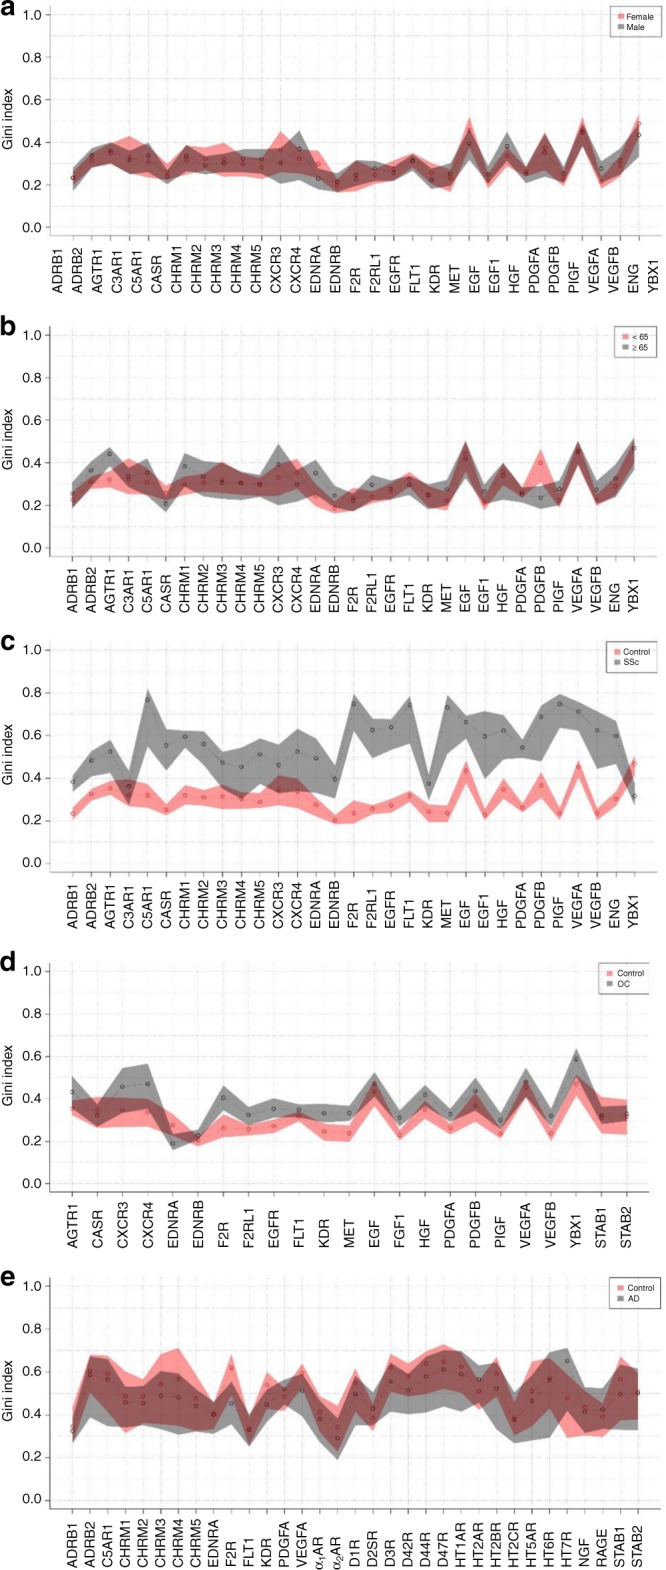
Autoantibody relationships reflect their concentration distribution patterns. Gini index confidence intervals were obtained by bootstrap analysis. The red and gray shadows represent confidence intervals, and each small circle indicates the Gini index value. The graphics exhibit comparisons of a HD females and males and b HD above and below 65 years of age (Supplementary Table 1, cohort 1; Supplementary Table 2, aab dataset 1) and comparisons between c HD and patients with systemic sclerosis (SSc, Supplementary Table 1, cohort 1; Supplementary Table 2, aab dataset 1, d HD and patients with ovarian cancer (OC, Supplementary Table 1, cohort 2; Supplementary Table 2, aab dataset 2) or e HD and patients with Alzheimer’s disease (AD, Supplementary Table 1, cohort 3; Supplementary Table 2, aab dataset 3)