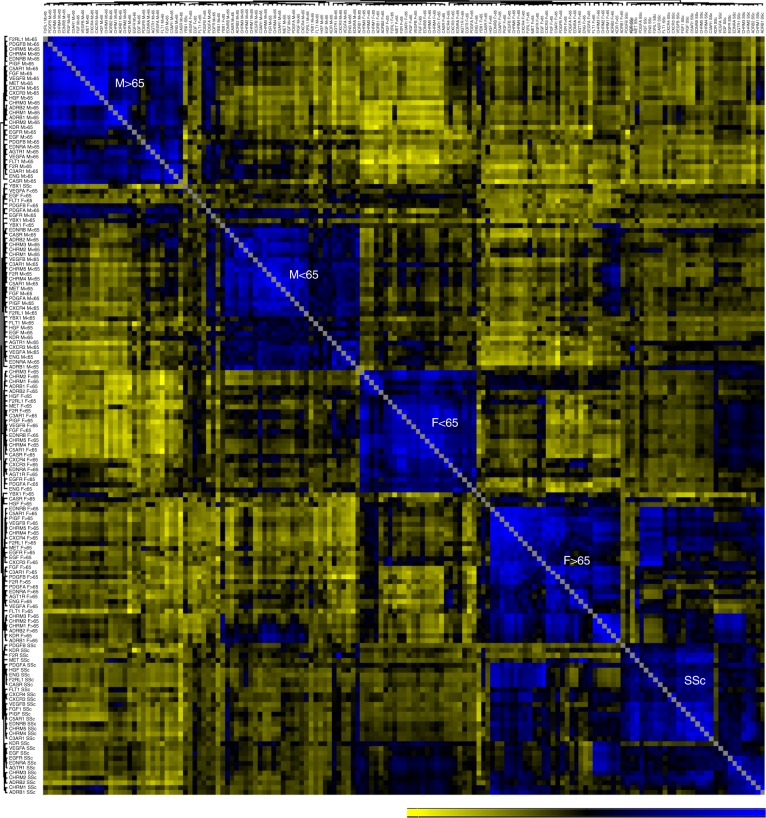
Fig. 6.
Hierarchical clustering of the autoantibody correlation signature. Correlogram matrix displays clusters (modules) of autoantibody (aab) correlations in all healthy donors (HD) according to gender and age (< and ≥65 years old) compared with patients with systemic sclerosis (SSc; Supplementary Table 1, cohort 1; Supplementary Table 2, aab dataset 1). Clusters of the correlations among aab are displayed in dendrograms on the top and side of the correlation matrix. The bar ranging from yellow to blue (−0.6 to 0.9) represents negative to positive correlations, respectively. In the heat map matrix, each small square represents the pairwise correlations between aab. The correlation matrix used to perform the hierarchical correlogram of SSc is provided as source data

