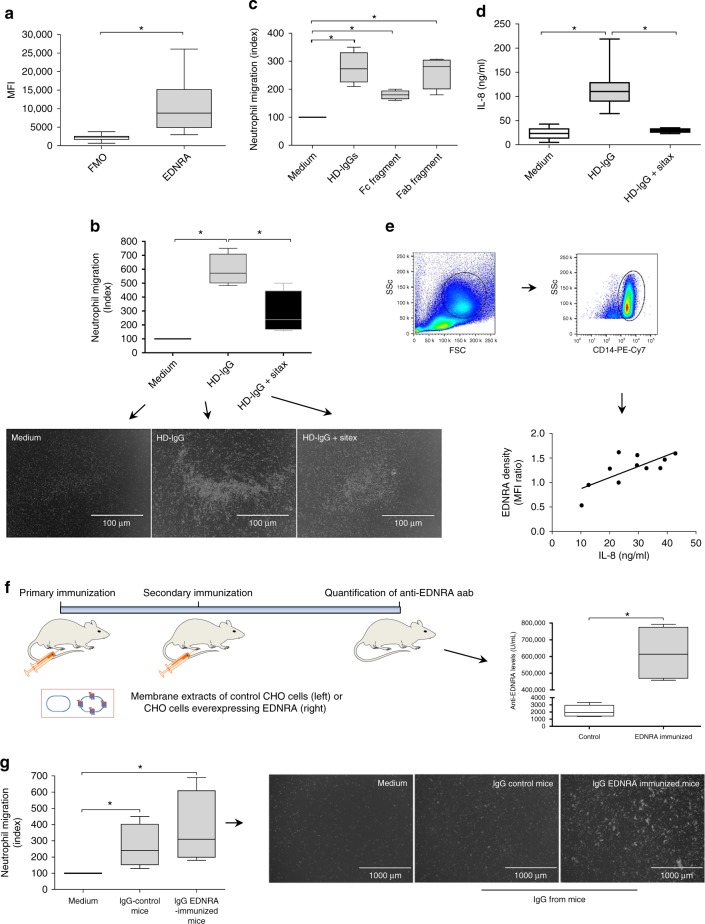
Fig. 8.
Effect of HD-IgG and anti-EDNRA autoantibodies on neutrophil migration. a Expression of endothelin receptor type A (EDNRA) by human neutrophils (n = 16). The fluorescence minus one control (FMO) was analyzed as shown in Supplementary Figure 5. b Neutrophil chemotaxis toward 0.5 mg/ml IgG from healthy donors (HD-IgG) in the presence or absence of the EDNRA antagonist sitaxsentan (sitax; n = 3). A representative image of neutrophils (white dots in the figure) on the bottom surface of transwell plates is shown. c Neutrophil migration toward intact human IgG, antigen-binding fragment (Fab), and the crystallized fragment (Fc) region. The results are representative of three independent experiments (n = 3). d HD-IgG-induced IL-8 production by peripheral blood mononuclear cells (PBMCs) in the absence (n = 13) or presence of sitax (n = 4). e IL-8 spontaneously released into the culture supernatants correlates with the level of EDNRA expression on CD14+ monocytes (n = 11). f Concentrations of anti-EDNRA autoantibodies (aab) in mouse sera were assessed after secondary immunization with membrane extracts from control Chinese hamster ovary (CHO) cells (n = 5) or CHO cells overexpressing human EDNRA (n = 4). Mouse images as well as syringe and membrane cartoons were adapted from Motifolio Drawing Toolkits (www.motifolio.com). EDNRA immunization was carried out by administration into footpads of 0.2 mg of membrane extracts prepared from CHO cells overexpressing human EDNRA (Celltrend, Germany). Three weeks after the primary immunization, mice were boosted with the same amount of membrane emulsified with incomplete Freund’s adjuvant (IFA, Sigma-Aldrich, USA). In the control group, mice were treated with the same amount of membrane extract from untransfected CHO cells. Six weeks after the booster immunization, all mice were sacrificed for sample collection and quantification of anti-EDNRA aab. g The migration of human neutrophils (white dots in the figure) toward IgG from control and EDNRA-immunized mice (n = 3). Error bars denote SD. *p ≤ 0.05 (unpaired t test)

