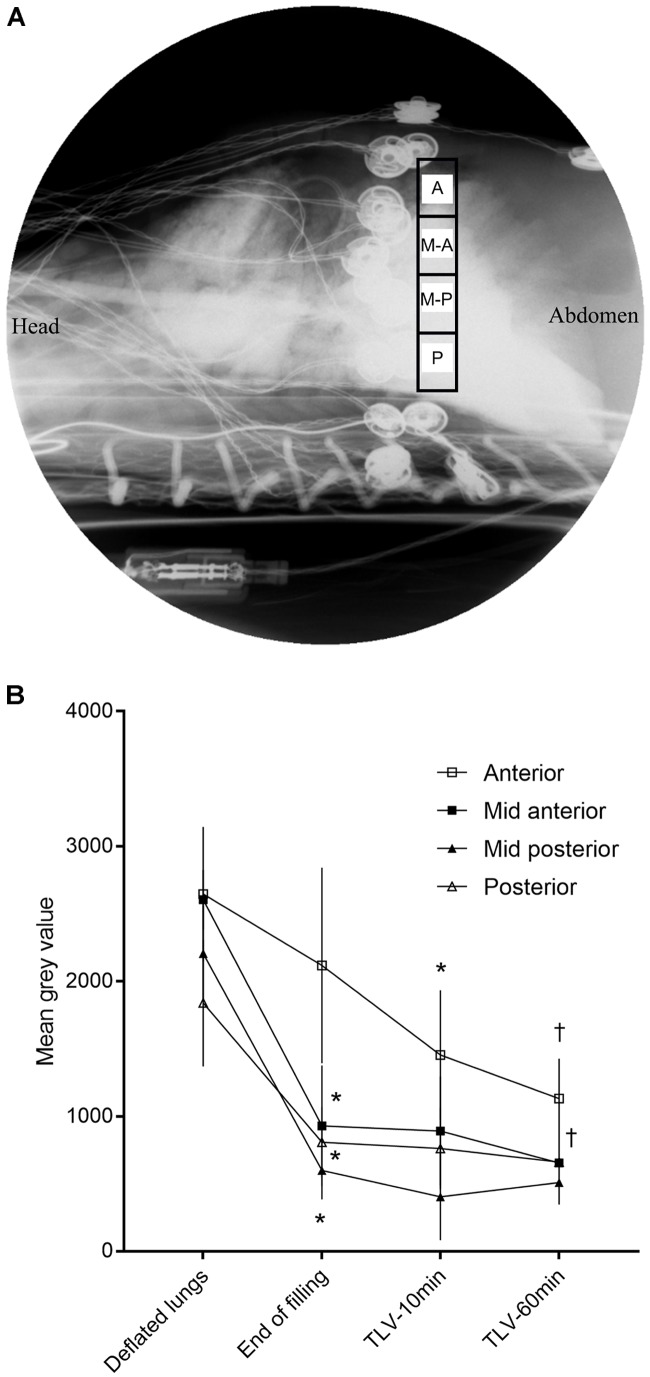
FIGURE 2.
Mean gray values obtained by fluoroscopy. (A) Fluoroscopic image of the thorax (lateral beam) showing the 4 regions of interest (A, anterior; M-A, mid-anterior; M-P, mid-posterior; P, posterior) for which a mean gray value was measured (note: image was converted from black to white given that most clinicians are accustomed to associate white with radio-opacity). (B) Absolute mean gray value (scale 0 = complete radio-opacity, to 4095 = completely radiolucent) throughout the protocol. A decrease in mean gray value represents an accumulation of perflubron. Values are presented as mean ± SD, n = 6. Statistical analysis using Friedman test for repeated measures followed by Wilcoxon signed-rank test. ∗First timepoint at which mean gray value differs from the deflated lung value (p < 0.05). †Compared to end of filling, the mid-anterior and the anterior region continue to accumulate PFC at 1 h of liquid ventilation (p < 0.05).

