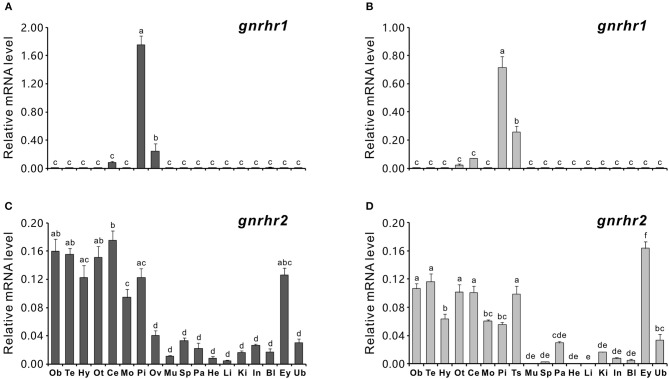
Figure 2.
Quantitative real-time PCR analysis of gnrhr1 and gnrhr2 mRNA levels in tissues of both female (A,C) and male (B,D) ricefield eels. Ob, olfactory bulb; Te, telencephalon; Hy, hypothalamus; Ot, optic tectum-thalamus; Ce, cerebellum; Mo, medulla oblongata; Pi, pituitary; Ov, ovary; Ts, testis; Mu, muscle; Sp, spleen; Pa, pancreas; He, heart; Li, liver; Ki, kidney; In, intestines; Bl, blood; Ey, eyes; Ub, urinary bladder. Data represents the mean of normalized expression levels ± SEM of 4 replicates. Means marked with different letters indicate significant differences (P < 0.05).

