Figure 7.
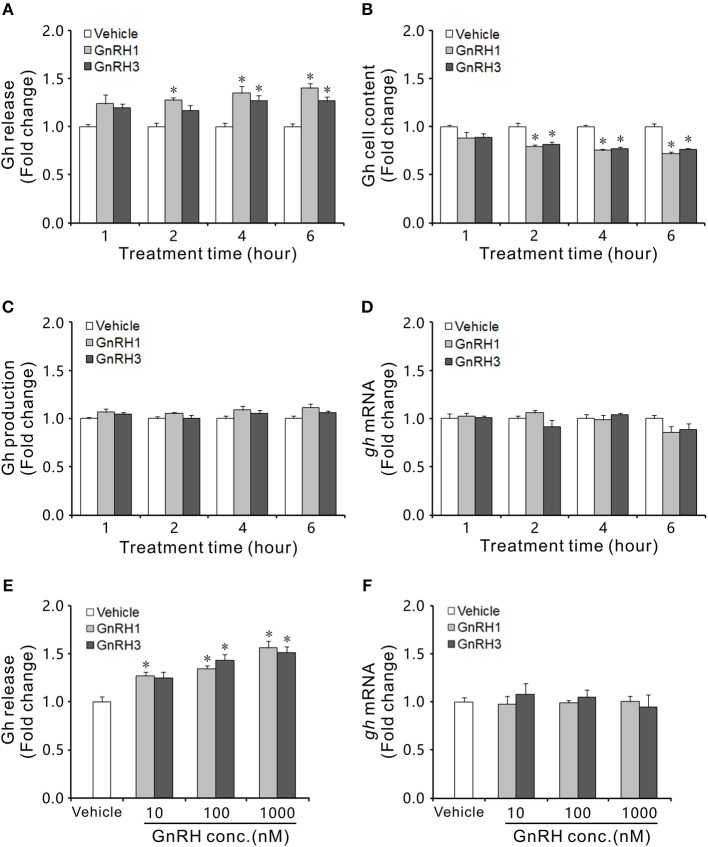
Effects of GnRH1 and GnRH3 on Gh synthesis and release in primary culture of pituitary cells of intersexual ricefield eels. Time course of GnRH1 (100 nM) and GnRH3 (100 nM) treatment on Gh release (A), cell content (B), total production (C), and mRNA expression (D) in primary culture of pituitary cells. (E,F), Dose-dependence of 4-h treatment with increasing levels of GnRH (10–1,000 nM) on Gh release and gh mRNA, respectively. After drug treatment, culture medium from individual well was harvested for measurement of Gh release by ELISA, and cell lysate was prepared for monitoring Gh content in pituitary cells. In parallel experiments, total RNA was isolated for real-time quantitative PCR of gh mRNA expression. Data were expressed as fold change relative to the corresponding controls. Bars represent means ± SEM (n = 4). The groups denoted by the asterisks (*) represent significant differences (P < 0.05) vs. the corresponding vehicle controls.

