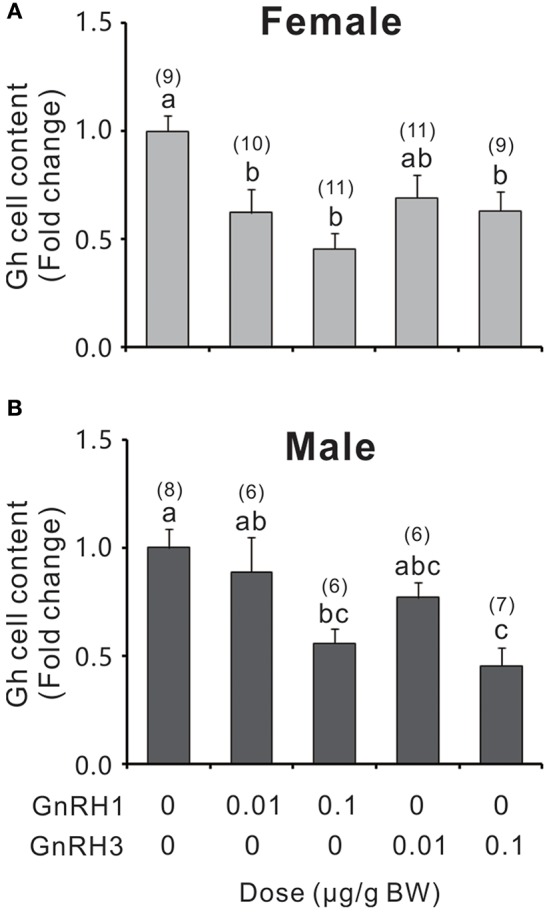
Figure 8.

Relative Gh levels in the pituitary of female (A) and male (B) ricefield eels after intraperitoneal injection of GnRH1 or GnRH3 (0.01 and 0.1 μg/g bodyweight), or 0.65% NaCl (Vehicle control) for 12 h. Numbers in parentheses represent the number of fish for each treatment. BW: bodyweight. Data were expressed as fold change relative to the corresponding vehicle control. Bars represent mean ± SEM (n = 6–11). Mean values marked with different letters are significantly different from each other (P < 0.05).
