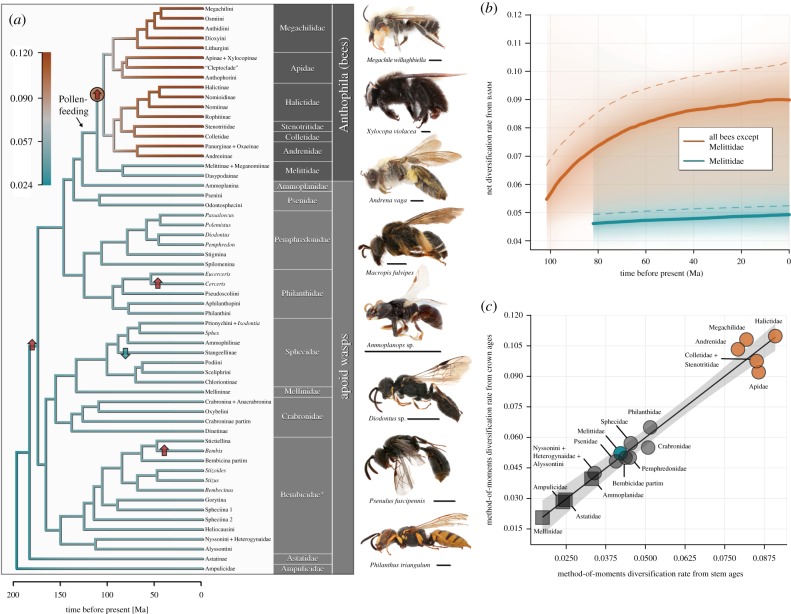
Figure 1.
Diversification dynamics of bees (Anthophila) and apoid wasps. (a) Dated phylogeny of Apoidea, based on Sann et al. [2]. Branches are coloured according to net diversification rates from bamm. The rate configuration with the highest posterior probability consisted of a single rate shift (f = 0.67), which is indicated by the red circle. The arrows indicate increases (red) and a decrease (blue) in diversification rates (r) identified through the maximum-likelihood-based method medusa (electronic supplementary material, figures S1–S4). We found no significant support for an increase in diversification along the branch of bees on which the evolutionary transition to pollen-feeding occurred. Family names follow the new classification of Sann et al. [2], and the chronogram corresponds to their tree 3. The family Bembicidae is followed by an asterisk owing to the placement of another family (Heterogynaidae) within. Scale bars next to specimens correspond to 2 mm. (b) Profiles of the two different diversification dynamics within bees, as identified by bamm. The average net diversification rate (solid lines) is 0.051 for Melittidae, and 0.080 for the remaining bee lineages combined. Dashed lines show speciation rates. (c) Clade-specific diversification rates from the phylogeny-independent method-of-moments estimator with ɛ = 0.5. Net diversification is inferred from both stem and crown ages. The shaded area indicates the 95% CI of the linear regression (F1,11 = 221.4, p ≤ 0.0001, R2 = 0.948, from the 13 samples for which stem and crown ages are available). Four groups did not have crown ages and are represented by square symbols. These are plotted at their stem-based rate value, but are placed directly on the regression line as an estimate of their crown-based rates. Lineages that mainly comprise generalist pollen-feeding species (orange) have higher mean diversification rates than the remaining groups (two-sample t14.99 = 12.452, p < 0.0001; based on stem age values).

