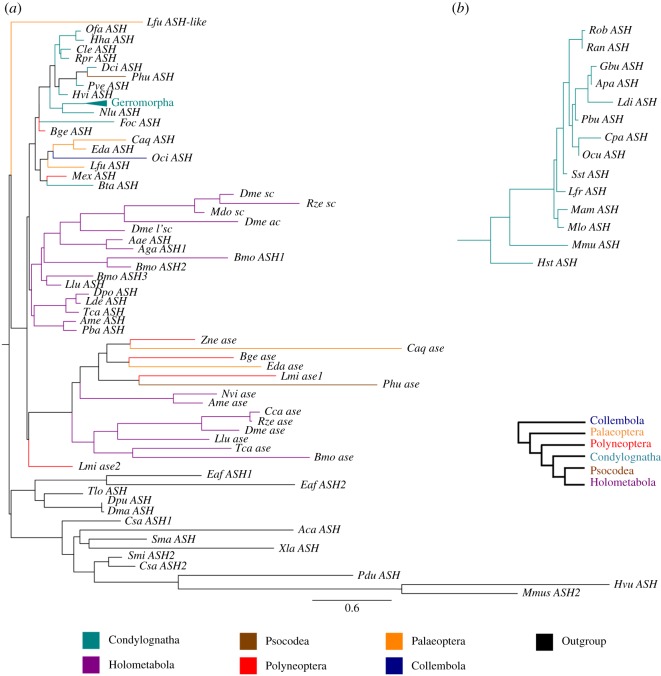
Figure 4.
Phylogram of the 77 taxon analyses obtained through maximum-likelihood and Bayesian reconstructions were conducted using LG + Γ and GTR + Γ models, respectively. (a) Full tree depicting all insect taxa used in this analysis. (b) Zoom on Gerromorpha clade. Support values are shown in the electronic supplementary material, figure S3. Scale bar indicates a number of changes per site.

