
Figure 2.
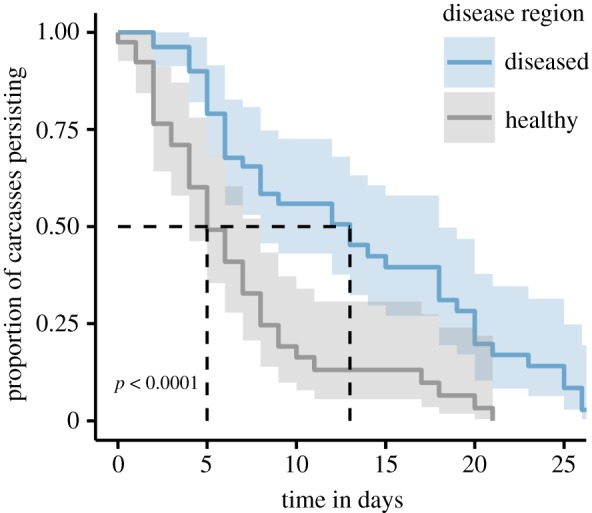
Carcass persistence. Kaplan–Meir estimate of the survival function for the proportion of carcasses persisting in the environment, divided into the two disease regions. Light shading shows the 95% confidence interval. The dotted line shows that median carcass persistence time is approximately 2.6-fold longer in the diseased region. The p-value is from the log-rank test comparing the survival curves. (Online version in colour.)