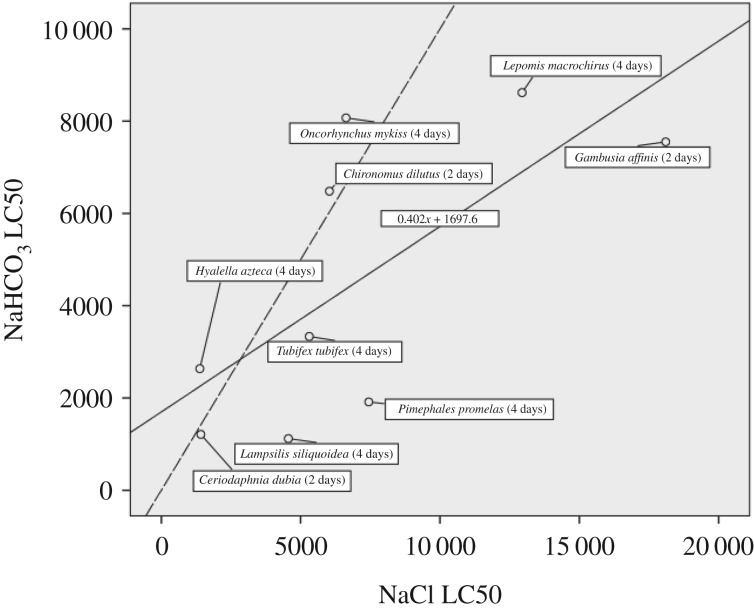
Figure 1.
Relationship between LC50 values for NaCl and NaHCO3 in terms of EC (mS cm−1) for freshwater animals in the ECOTOX database. The solid line is the least-squares regression line; the dashed line is 1 : 1 line for reference. The least-squares regression line is described by: y = 0.402x + 1697.6.

