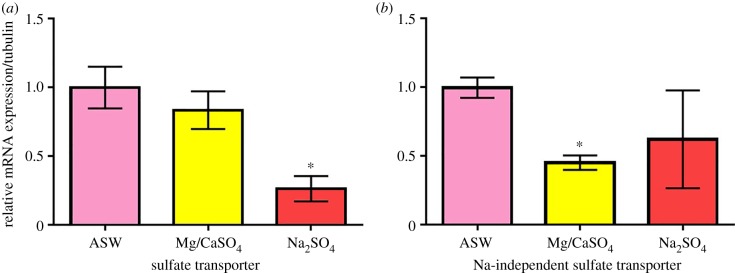
Figure 5.
Relative mRNA expression of N. triangulifer larvae subjected to 24 h sulfate stress treatment. All data are normalized to control (ASW). Error bars represent standard deviations from the mean (n = 6). A Student's t-test was performed and an asterisk indicates significant difference compared to ASW control. (Online version in colour.)

