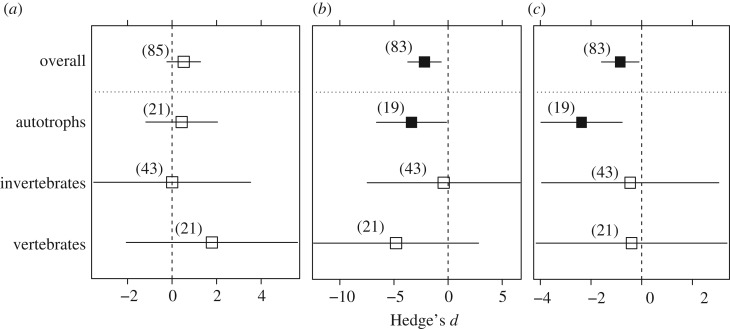
Figure 2.
Mean effect sizes (Hedge's d ± 95% confidence intervals), overall and by organism groups of (a) joint effect, (b) salinity individual main effect and (c) stressors B individual main effect. The number of observations (n) of each analysis is indicated in parentheses. Filled black squares indicate significant effects (p < 0.05).

