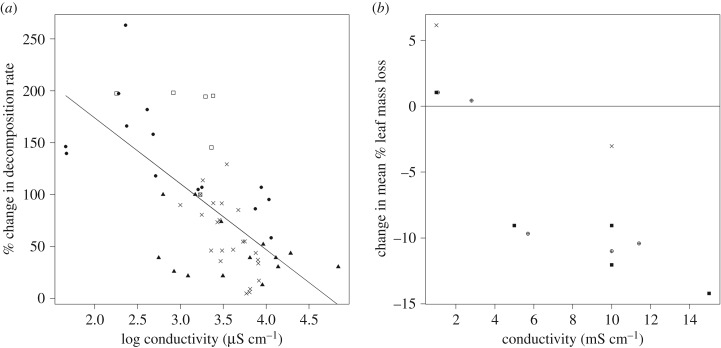
Figure 1.
(a) Relationship between conductivity and organic matter breakdown rates (R2 = 0.43, p < 0.001). Data are combined from four case studies (different symbols) published in three papers [39,41,45], n = 57. Breakdown rates per degree day were standardized relative to the breakdown rate determined at a conductivity of approximately 1700 µS cm−1, which was a level occurring across all studies. (b) Difference in the mean % leaf mass loss relative to a low salinity control level from controlled mesocsom experiments [39,43,44]. Different symbols denote different salt types used to achieve experimental conductivity levels; circle with plus sign, NaCl; filled square, sea salt; times, NaHCO3.

