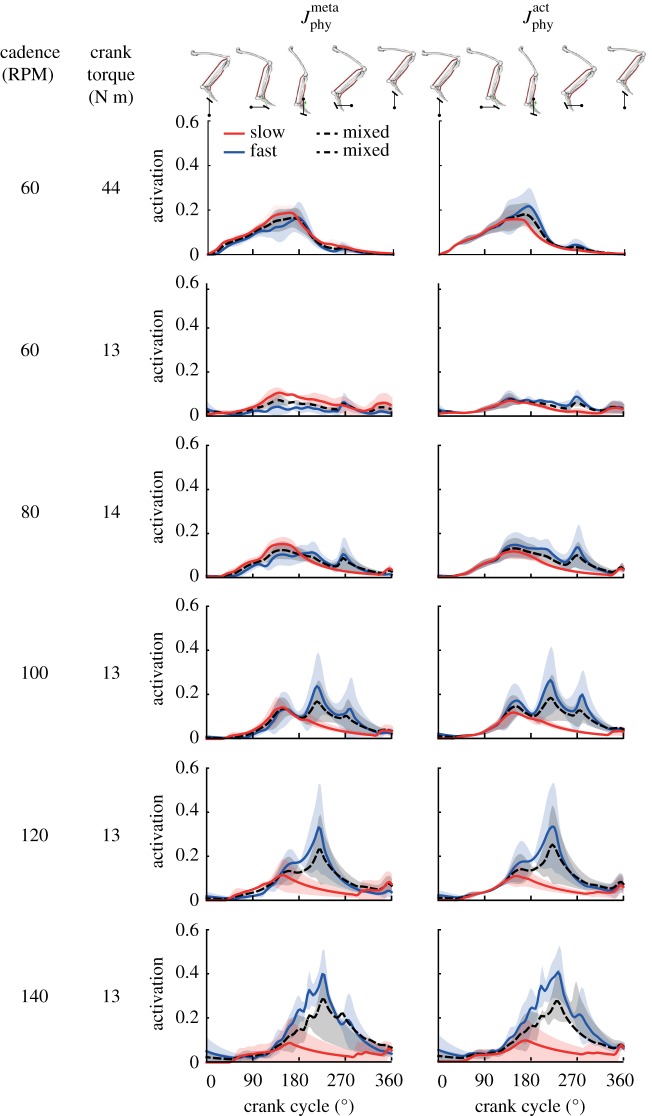
Figure 5.
Predicted time-varying muscle activations (mean ± 1 s.d.) of the plantarflexor muscle fibre types for three cyclists across six pedalling conditions. Muscle activation was bounded between 0 (no activation) to 1 (fully activated). The model images above the plots depict the orientation of the lower limb and the crank. Two muscle fibre combinations (slow–fast and mixed–mixed) and two weighted cost functions (min-metabolic-activation function ( ) (left) and min-activations (
 ) (right)) were used. (Online version in colour.)

