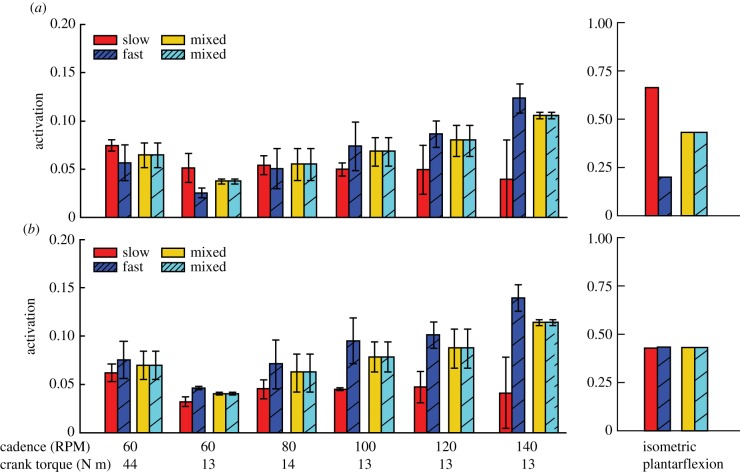
Figure 6.
Mean activations of the muscle fibre types of the plantarflexor across six pedalling conditions and one simulated ramped isometric plantarflexion. Two muscle fibre combinations (slow–fast and mixed–mixed) and two weighted cost functions ((a) min-metabolic-activation function ( ) and (b) min-activations (
 )) were used. Note that the mixed–mixed plantarflexor fibre combination (yellow and cyan bars) was predicted in separate simulations to the slow and fast (red and blue bars) plantarflexor fibre combination. (Online version in colour.)

