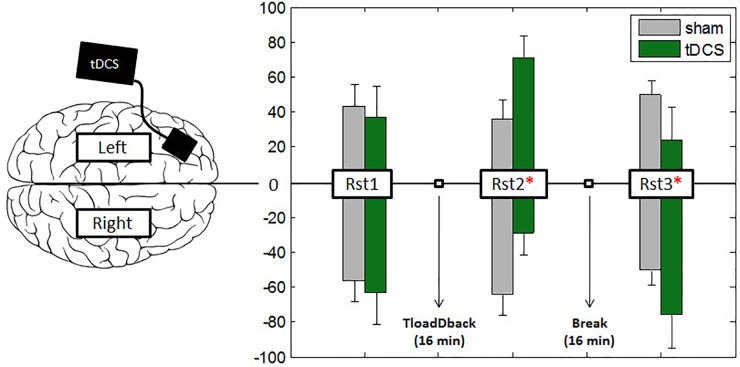
FIGURE 4.
Asymmetric interhemispheric activation between conditions. Bars represent the percentage of total activity per hemisphere during the three resting states. Participants started the experiment with a 4-min resting state (Rst1) session followed by the 16-min performance with the TloadDback task. Right after they followed two more 4-min resting states (Rst2–Rst3) sessions. To test the middle-term effects of tDCS, a 16-min recovery period was introduced between resting states Rst2 and Rst3. A value of –100 in the y-ax indicates pure right-hemispheric dominance, and a value of +100 pure left-hemispheric dominance. Vertical bars represent standard errors and asterisks represent the existence of a significant asymmetry between hemispheres.

