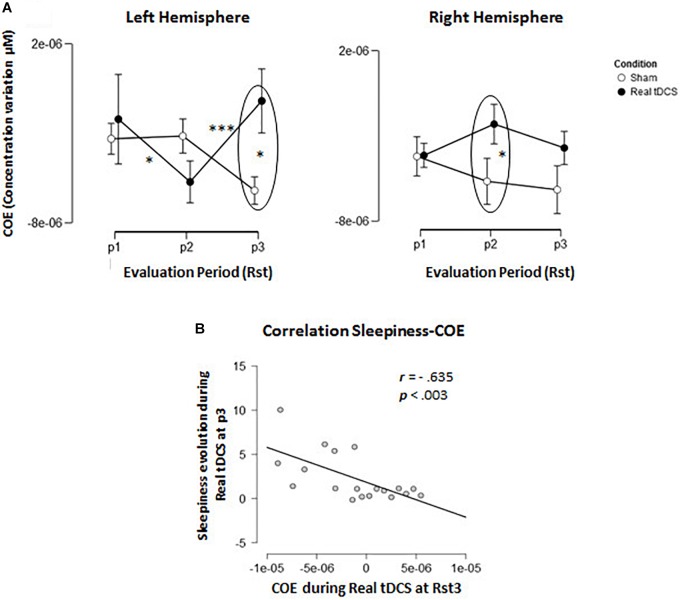
FIGURE 5.
Cerebral oxygenation exchange (COE). (A) Evolution of delta COE during Conditions across the 3 resting state sessions in the left and right hemisphere. (B) Correlation-plot between COE levels at resting state 3 (RSt3) in the left hemisphere and evolution of sleepiness during the same period.

