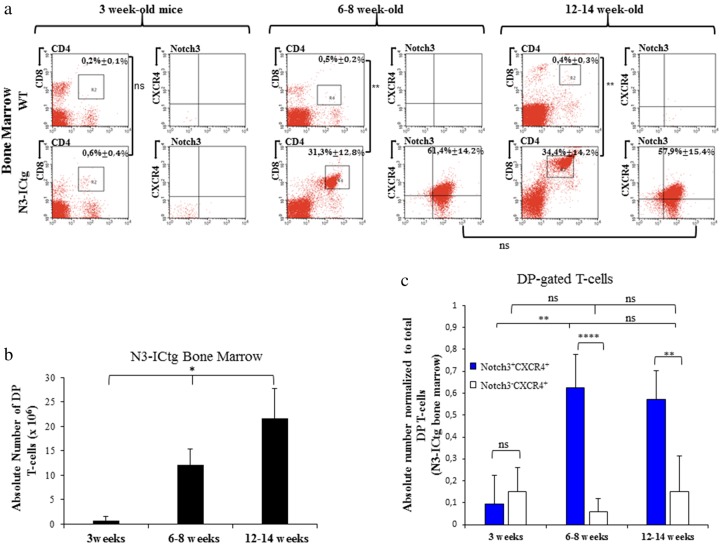
Fig. 4.
Notch3+CXCR4+DP T-cells increasingly infiltrate N3-ICtg BM with disease progression. In a, 3 weeks, 6–8 weeks, and 12–14 weeks of age WT (n = 4) and N3-ICtg (n = 6) BM. On the left of each figure section: representative plots of T-cell subset distribution. On the right: Notch3+CXCR4+ co-expression within DP-gated T-cells. The average percentages ± SD are shown. (**p<0.01; ns, not significant). b Absolute numbers of DP cells infiltrating transgenic (n = 3) BM (*p < 0.05, one-way ANOVA test). c Absolute numbers of Notch3+CXCR4+ and/or Notch3−CXCR4+DP-cells normalized to total DP gated cells of N3-ICtg bone marrow. For each corresponding age, at least five N3-ICtg mice were used. One-way ANOVA (Tukey’s post-test) and Student’s t-test performed where appropriate (**p < 0.01; ****p < 0.0001; ns, not significant)

