Fig. 5.
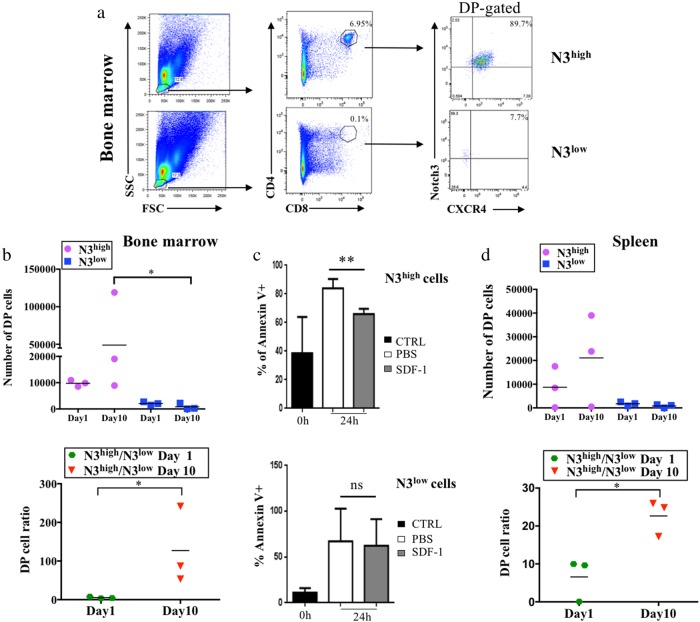
Selective homing and engraftment of N3-ICtg DP thymocytes, highly expressing Notch3 and CXCR4. a (CD4+CD8+Notch3+highCXCR4+high) N3high or (CD4+CD8+Notch3+lowCXCR4+high) N3low thymocytes engraft in BM day10 post-intravenous injection (i.v.). Percentages of DP cells (middle) and of CD4+CD8+Notch3+CXCR4+ (right). b Absolute numbers of DP infiltrating NSG BM after N3high (purple-circle) or N3low (blue-square) thymocytes i.v. (upper, Kruskal–Wallis test) and the ratio N3high/N3lowDP cells at day1 (green-hexagon) and day10 (red-triangle) (lower, Mann–Whitney test) (*p<0.05). c Ex vivo experiments: percentages of AnnexinV+cells in N3high (upper) and N3low (lower) thymocytes in 24 h SDF-1-treated relative to saline (PBS). Data are represented as meanvalue ± SD (**p < 0.01; ns, not significant; Student’s t-test). d Absolute DP T-cell numbers in spleen after N3high (purple-circle) or N3low (blue-square) DP thymocytes i.v. (upper) and the ratio of N3high/N3lowDP T-cells (lower) at day1 (green-hexagon) and day10 (red-triangle) (*p<0.05; Student’s t-test, Mann–Whitney). See also Figure S3A and B

