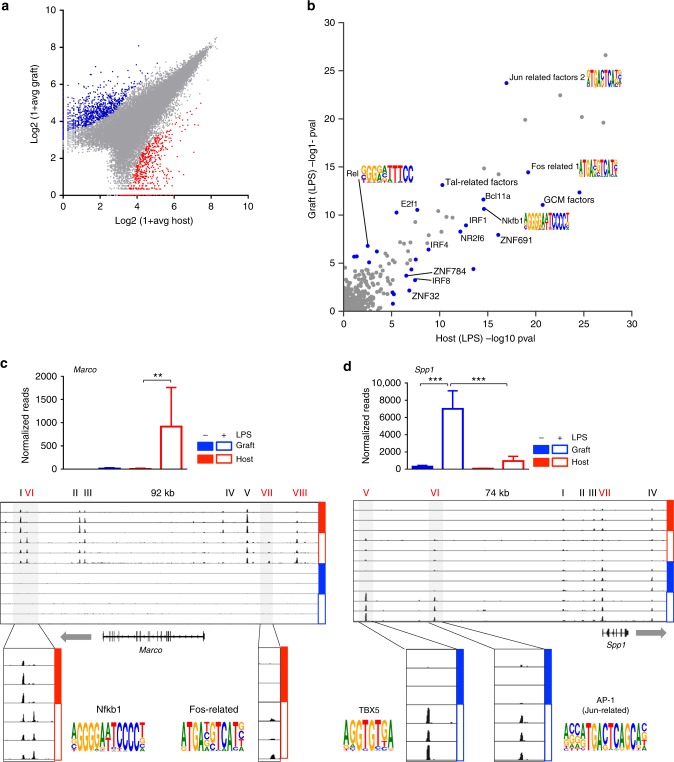
Fig. 6.
Comparative epigenome analysis of graft and host microglia post LPS challenge. a Analysis of all 46,485 detected ATAC peaks, from which 552 peaks and 841 peaks displayed >4-fold significant (p-value < 0.01) enrichment in host microglia and engrafted cells isolated from challenged mice, respectively. b Comparison of motif significance in activated/challenged host and grafted cells. P-values were calculated using TBA models trained on intergenic ATAC-seq peaks from host and grafted cells. Significant motifs that show a large difference (p < 10e−5, log-likelihood ratio > = 2) are indicated in blue points. Motif logos visualizing the position frequency matrix of NF-kappaB and AP-1 motifs are annotated. c Challenge induced alterations in Marco locus. Normalized sequence reads of Marco mRNA in engrafted cells and host microglia isolated from LPS challenged and unchallenged BM chimeras (top); normalized ATACseq profiles of Marco locus (bottom), with enlarged areas highlighting induced ATACseq peaks and predicted motifs. d Challenge induced alterations in Spp1 locus. Normalized sequence reads of Spp1 mRNA in engrafted cells and host microglia isolated from LPS challenged and unchallenged BM chimeras (top); normalized ATACseq profiles of Spp1 locus (bottom), with enlarged areas highlighting induced ATACseq peaks and predicted motifs. Source data are provided as a Source Data file

