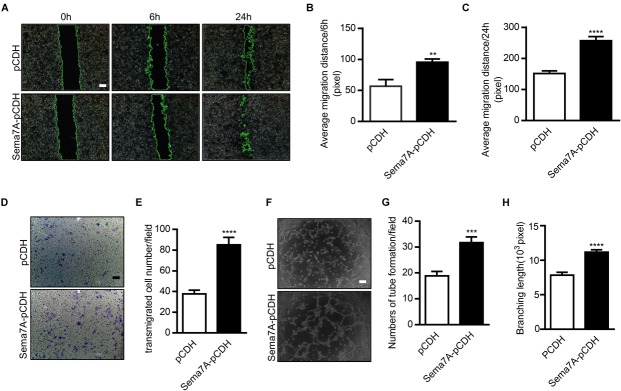
FIGURE 2.
Overexpression of Sema7A promotes endothelial cell migration and tube formation. (A) Lenti-pCDH-hSema7A-GFP-transduced HUVECs and Lenti-pCDH-GFP-transduced control HUVECs were cultured and then subjected to wound healing assay at selected time points. Phase contrast images are from the start of the assay (0 h) and after 6/24 h. Location of initial scratch margins indicated by dashed green lines. Bar = 100 μm. (B,C) Quantified distances of Sema7A overexpression on cell migration from (A) for 6/24 h migration ability. Data are shown as mean ± SEM. Results are representative of ≥ 3 independent experiments. ∗∗P < 0.01; ∗∗∗P < 0.001. (D) Representative images of transwell membranes with cells stained by crystal violet. Membranes were fixed for 24 h after seeding. Bar = 50 μm. (E) The number of migrated cells in Sema7A-pCDH-HUVECs and control pCDH-HUVECs from D. Data are shown as mean ± SEM. Results are representative of ≥ 3 independent experiments. ∗∗∗∗P < 0.0001. (F) Sema7A-pCDH-HUVECs and control pCDH-HUVECs are subjected to in vitro tube formation assay. Bar = 50 μm. (G,H) Quantified data from F for tube formation numbers (G) and total branching length (H). Data are shown as mean ± SEM. Results are representative of ≥ 3 independent experiments. ∗∗∗P < 0.001; ∗∗∗∗P < 0.0001.

