FIGURE 3.

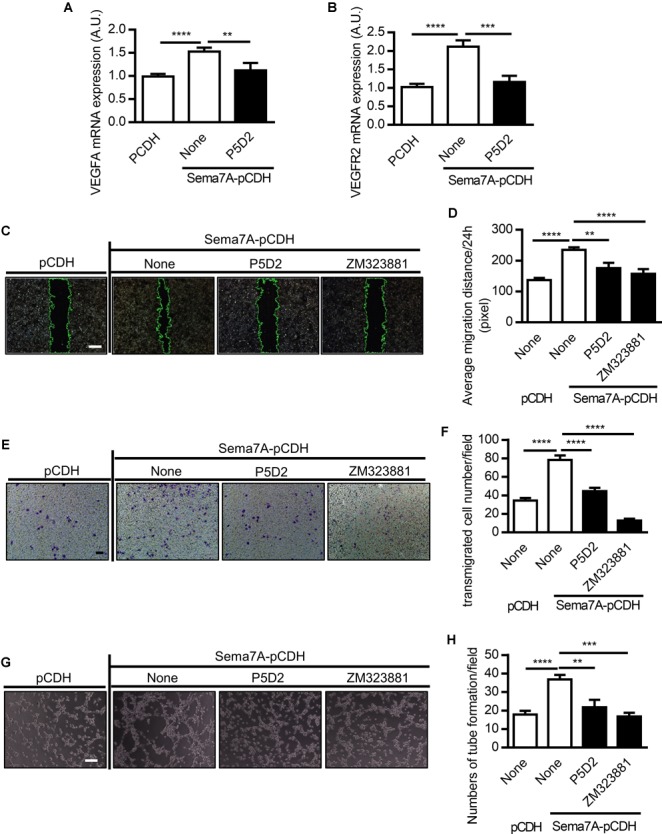
Sema7A enhances VEGFA/VEGFR2 induced cell migration and tube formation through integrin β1. VEGFA (A) and VEGFR2 (B) mRNA expression in Sema7A-pCDH-HUVECs and pCDH-HUVECs were analyzed by QPCR. Cells were further treated with integrin β1 blocking antibody (P5D2, 1 μg/ml) before VEGFA (A) and VEGFR2 (B) detected. Data are shown as mean ± SEM. Results are representative of ≥ 3 independent experiments. A.U = arbitrary unit. ∗∗P < 0.01; ∗∗∗P < 0.001; ∗∗∗∗P < 0.0001. (C) Sema7A-pCDH-HUVECs and pCDH-HUVECs were treated with integrin β1 blocking antibody (P5D2, 1 μg/mL) or VEGFR2 inhibitor (ZM323881, 10 μM) for 24 h and then subjected to wound healing assay at selected time points. Phase contrast images are from the start of the assay (0 h) and after 24 h. Location of initial scratch margins indicated by dashed green lines. Bar = 100 μm. (D) Quantified data from (C) for 24 h migration ability. Data are shown as mean ± SEM. Results are representative of ≥ 3 independent experiments. ∗∗P < 0.01; ∗∗∗∗P < 0.0001. (E) Representative images of transwell membranes with cells stained by crystal violet. Membranes were fixed 24 h after seeding. Cells were prepared as in (C). Bar = 50 μm. (F) Quantified numbers of migrated cells in Sema7A-pCDH-HUVECs and control pCDH-HUVECs. Data are shown as mean ± SEM. Results are representative of ≥ 3 independent experiments. ∗∗∗∗P < 0.0001. (G) Sema7A-pCDH-HUVEC and control pCDH-HUVECs were subjected to tube formation assay followed blocking pretreatment as in (C). Bar = 50 μm. (H) Quantified data from (G) for tube formation numbers. Data are shown as mean ± SEM. Results are representative of ≥ 3 independent experiments. ∗∗P < 0.01; ∗∗∗P < 0.001; ∗∗∗∗P < 0.0001.
