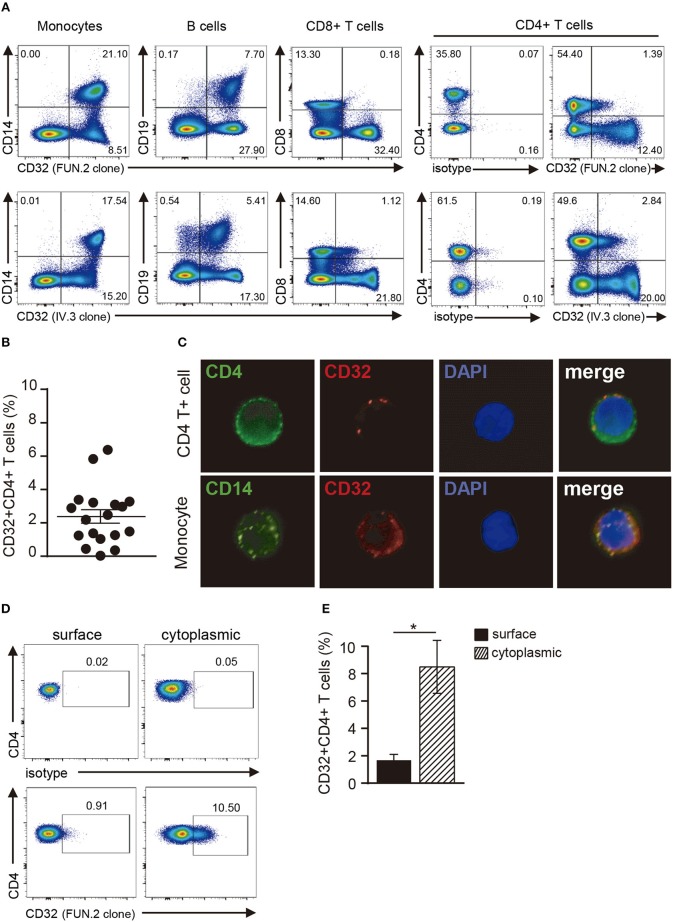
Figure 1.
Analysis of CD32 expression in resting CD4+ T cells. (A) Representative dot plot of CD32 cell surface expression in monocytes (CD14+), B cells (CD19+), CD8+ and CD4+ T cells from a healthy adult donor using two different anti-CD32 mAb (FUN.2 and IV.3 clones) analyzed by flow cytometry. Surface isotype control labeling was set to stringent criteria. Results are expressed as percentages on PBMCs. (B) Frequency of CD32+ cells on gated CD4+ T cells from healthy adults using the FUN.2 clone mAb by flow cytometry. (C) Fluorescence microscopy of CD32 expression in purified CD4+ T cells and monocytes (green: CD4 or CD14, red: CD32). Nuclear counterstain with DAPI was used. Representative images are shown at x300. (D) Representative dot plot of cell surface and cytoplasmic CD32 expression in permeabilized resting CD4+ T cells. Surface and cytoplasmic isotype controls are shown. (E) Frequency of cell surface and cytoplasmic CD32 expression on resting CD4+ T cells. Results are expressed as percentages on CD4+ T cells. Representative experiments are shown in (A,C,D). Mean ± SEM of n donors are shown in (B) (n = 18) and (E) (n = 9). *p < 0.05. Wilcoxon matched-pairs signed rank test was used for analysis in (E).

