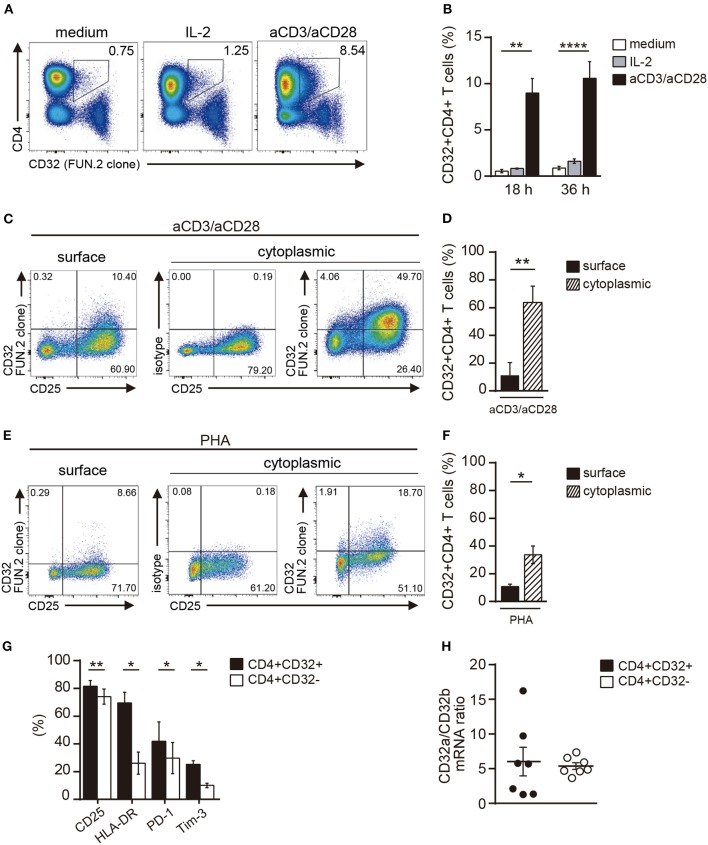
Figure 2.
Activation of CD4+ T cells results in an increased expression of CD32. (A,B) PBMCs were cultured with medium (controls), IL-2 (20 ng/ml) or immobilized anti-CD3 (10 μg/ml) plus soluble anti-CD28 (1 mg/ml) (aCD3/aCD28) antibodies, during 18 or 36 h. The frequency of CD32+CD4+ T cells was analyzed by flow cytometry. (A) Representative dot plots of cell surface expression of CD32 in CD4+ T cells analyzed at 36 h of culture. Results are expressed as percentages on total lymphocytes. (B) Frequency of CD32+ cells on gated CD4+ T cells at 18 and 36 h of culture. (C–F) PBMCs were activated with either aCD3/aCD28 antibodies (C,D) or PHA (4 μg/ml, E,F) for 36 h. Then, cell surface or intracellular expression of CD32 was analyzed. Cell surface expression of CD25 was also assessed. Cytoplasmic isotype control is shown in (C,E). (G) Cell frequency of the different markers analyzed in CD32+CD4+ and CD32-CD4+ T cells. Results are expressed as percentage on each CD4+ T cell subset analyzed. (H) CD32a/CD32b mRNA ratio in activated CD32-CD4+ and CD32+CD4+ T cell subsets analyzed by qRT-PCR. Representative experiments are shown in (A,C,E). Mean ± SEM of n donors are shown in (B) (n = 7), (D) (n = 7), (F) (n = 7), (G) (n = 8), and (H) (n = 7). *p < 0.05, **p < 0.01, ****p < 0.0001. Kruskal–Wallis test followed by Dunn's multiple comparison was used for analysis in (B). Wilcoxon matched-pairs signed rank test was used for analysis in (D,F,G,H).

