Figure 3.
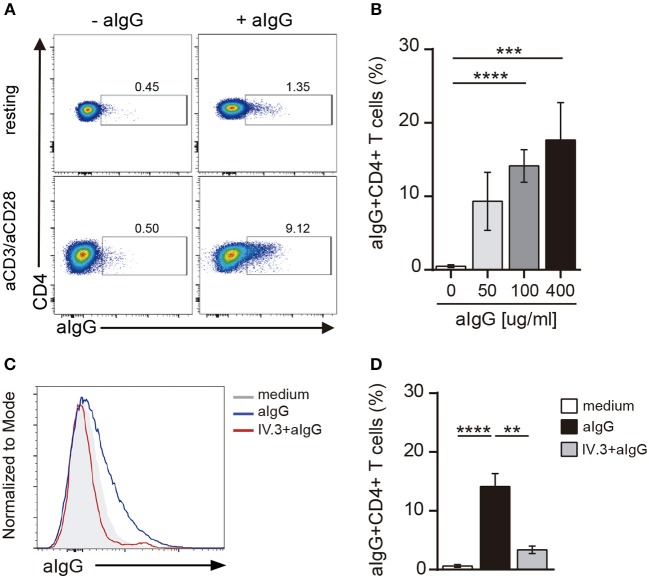
CD4+ T cells bind aIgG. (A) Resting or activated purified CD4+ T cells were incubated with aIgG (400 μg/ml) or serum-free medium for 2 h. Then, cells were washed and the binding of aIgG was analyzed by flow cytometry. (B) Activated CD4+ T cells were incubated with increasing concentrations of aIgG (50, 100, and 400 μg/ml) or serum-free medium. Data show the percentage of aIgG+CD4+ T cells. (C,D) Activated CD4+ T cells were treated with or without an anti-CD32 blocking antibody (IV.3 clone, 30 μg/ml) during 30 m. After washing, cells were incubated with 100 μg/ml of aIgG or serum-free medium. (C) Representative histograms of aIgG percentage are shown. (D) Percentage of aIgG+CD4+ T cells is shown. Representative experiments are shown in (A,C). Mean ± SEM of n donors are shown in (B) (n = 8) and (D) (n = 8). **p < 0.01, ***p < 0.001, ****p < 0.0001. Kruskal–Wallis test followed by Dunn's multiple comparison was used for analysis in (B). Mann–Whitney test was used for analysis in (D).

