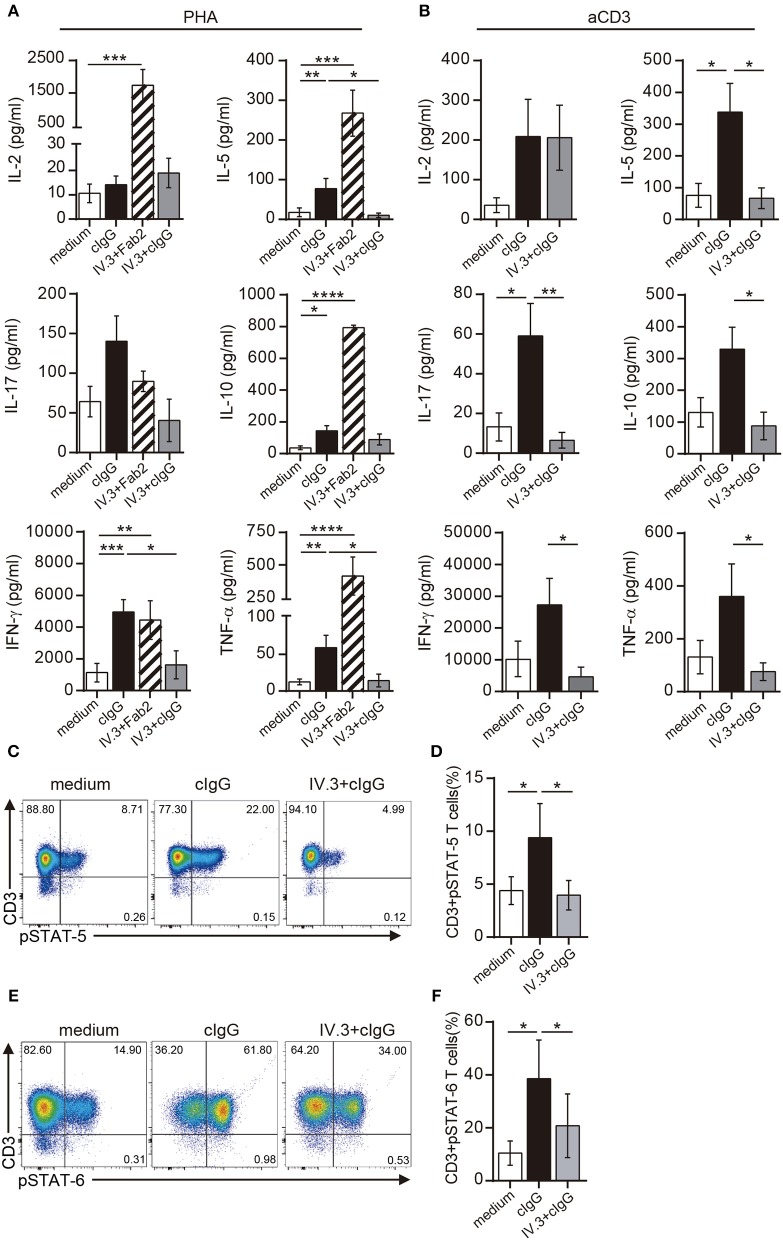
Figure 5.
Stimulation through CD32 promotes the release of cytokines in CD4+ T cells activated by suboptimal doses of different stimuli. (A,B) Purified CD4+ T cells (1 × 10⁶) were cultured in the presence of medium (control, white bar), cIgG (black bar) or IV.3 plus a Fab′2 antibody directed to mouse IgG (striped bar), for 18 h. When IV.3 was used as blocking mAb, cells were pretreated with IV.3 clone, before being exposed to cIgG (gray bar). Then, cells were stimulated with a suboptimal concentration of PHA (0.5 μg/ml, A) or anti-CD3 (0.025 μg/ml, B) and cultured for 5 d. Levels of cytokines were quantified in the culture supernatant by ELISA. (C–F) Purified CD4+ T cells (1 × 10⁶) were cultured in the presence of medium or cIgG for 18 h. When IV.3 was used as blocking mAb, cells were pretreated with IV.3 clone, before being exposed to cIgG. Then, cells were stimulated with a suboptimal concentration of PHA (0.5 μg/ml) and cultured for 3 d. STAT5 (C,D) and STAT6 (E,F) phosphorylation was analyzed by flow cytometry. Results are expressed as percentage on CD4+ T cells. Representative experiments are shown in (C,E). The mean ± SEM of n experiments is shown in (A) (n = 10), (B) (n = 6), (D) (n = 5), and (F) (n = 5). *p < 0.05, **p < 0.01, ***p < 0.001, ****p < 0.0001. Mann–Whitney test was used for analysis in (A,B). Kruskal–Wallis test followed by Dunn's multiple comparison was used for analysis in (D,F).

