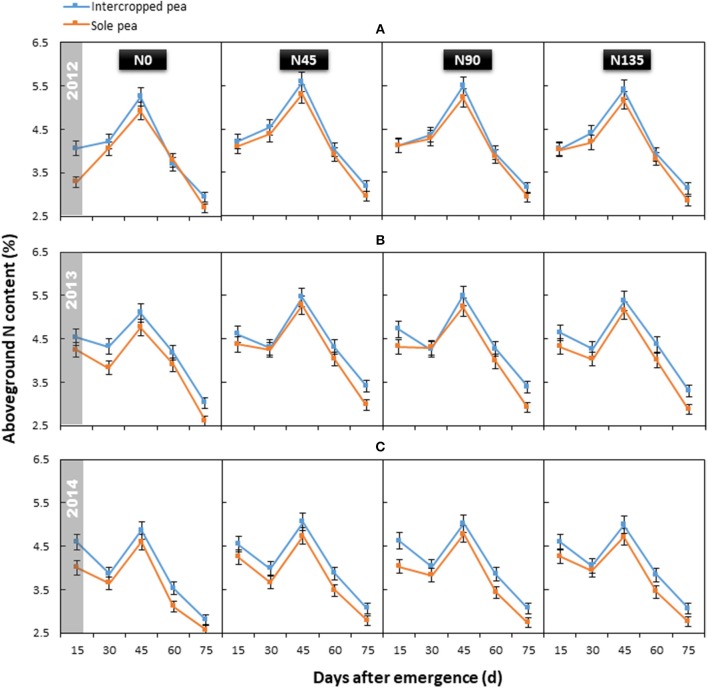
Figure 3.
Aboveground N content of intercropped pea and sole pea in (A) 2012, (B) 2013, and (C) 2014. N0 is the non-N fertilized control. N45, N90, and N135 represent N fertilizer applied at 90 kg N ha−1 as base fertilizer at sowing plus 45, 90, and 135 kg N ha−1 top-dressed at flowering, respectively. Error bars are standard errors of the means.

