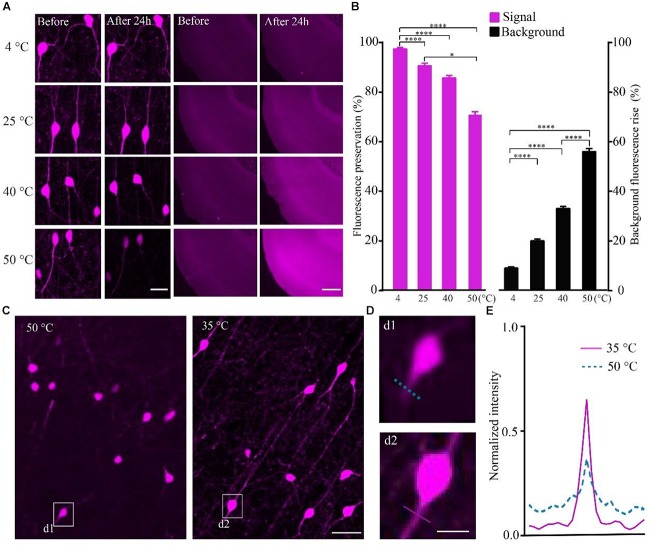
FIGURE 2.
Increasing the fluorescent intensity of tdTomato and decreasing the background fluorescence with lower polarization temperatures. (A) tdTomato fluorescence and background fluorescence at different temperatures (scale bar in left column: 20 μm; scale bar in right column: 500 μm). (B) Fluorescent protein preservation ratio and the background fluorescence rising rate at different temperature (each column filled with magenta n = 8, each column filled with black n = 3). Error bars represent SD. One-way ANOVA followed by Tukey’s post hoc tests (∗p < 0.05, ∗∗∗∗p < 0.001). (C) Fluorescence brightness of the tdTomato fluorescence (scale bar: 20 μm). (D) Enlarged images from C showing the fibers around the soma after embedding at different conditions (scale bar: 10 μm). (E) Fluorescence intensity plots for the lines labeled in (d1 and d2).

