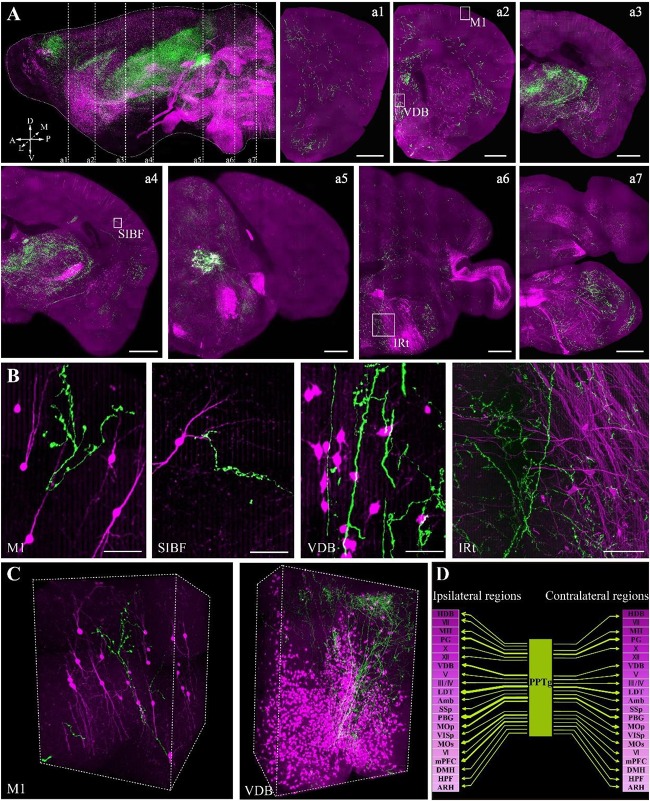
FIGURE 5.
Whole-brain imaging of dual color-labeled neurons in a ChAT-IRES-Cre::Ai14 mouse brain. (A) Sagittal reconstruction of the maximum intensity projection and continuous coronal sections in the ChAT-IRES-Cre::Ai14 mouse brain. Projection thickness was 100 μm. Maximum-intensity projections were reconstructed at a resolution of 2 μm × 2 μm × 2 μm. Red signals indicate tdTomato-positive cholinergic neurons, while green signals are GFP-labeled cholinergic fibers from the PPTg. A, anterior; P, posterior; D, dorsal; V, ventral; M, medial; L, lateral (scale bar: 500 μm). (B) The enlarged details of A (scale bar: 50 μm). (C) 3D reconstructions of the GFP and tdTomato signals in M1 and VDB, respectively. (D) The projections of the cholinergic PPTg to other cholinergic neuron-enriched nuclei. Crimson represents a dense distribution of cholinergic neurons, and lighter colors signify fewer cholinergic neurons in the nucleus. Arrow thickness represents the density of cholinergic projection from the PPTg.

