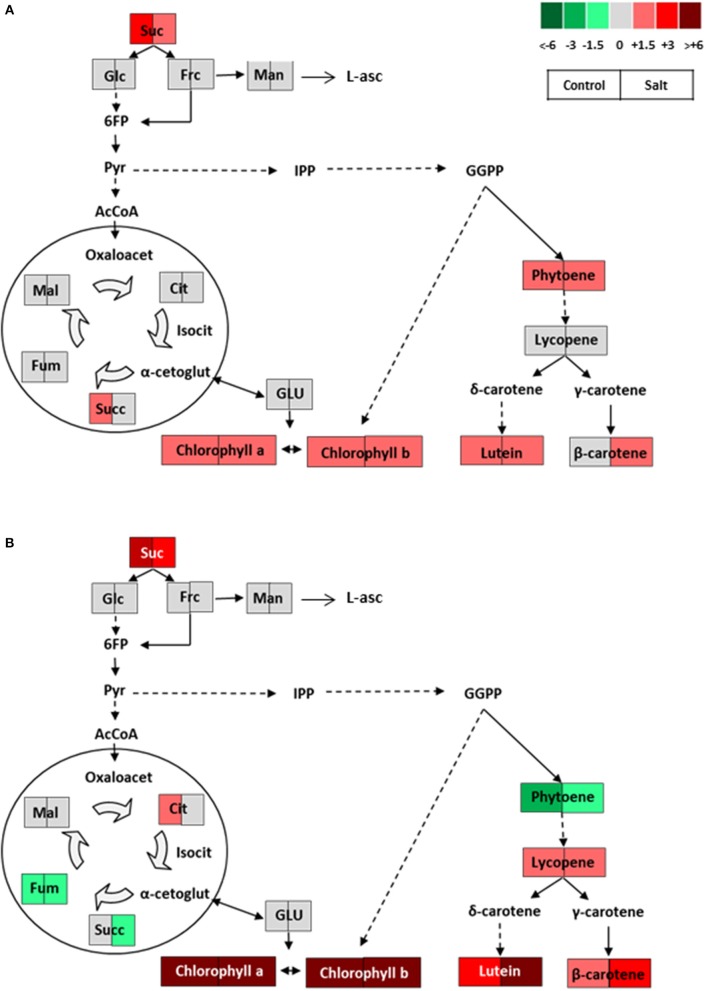
Figure 7.
Schematic representations of the metabolic changes occurring in (A) green and (B) ripe fruits of NegroYeste from plants grown without stress (control) and with salt stress (100 mM NaCl during 70 days). Data were normalized to Moneymaker. Color scale is used to display the different amount of metabolite in terms of fold-change relative to the level in the appropriate control. Suc, sucrose; Glc, glucose; Frc, fructose; Man, mannose; L-asc, L-ascorbic acid; 6FP, fructose-6-phosphate; Pyr, pyruvate; IPP, isopentenyl diphosphate; GGPP, geranylgeranyl diphosphate; AcCoA, acetylCoA; Oxaloacet, oxaloacetate; Cit, citrate; Isocit, isocitrate; α-cetoglut, α-cetoglutarate; Succ, succinate; Fum, fumarate; Mal, malate; GLU, glutamate.

