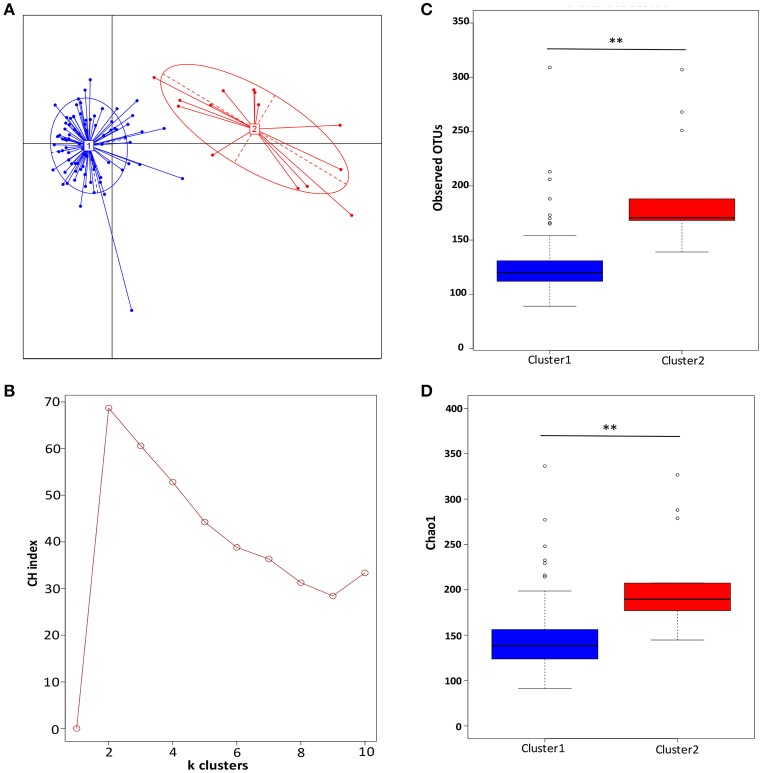
Figure 1.
Two clusters were observed in ascitic fluids microbiota. (A) The principal coordinate analysis of the Jensen-Shannon distance generated from the OTU-level relative abundance profiles. Samples are colored by clusters identified by the partitioning around medoids clustering algorithm. Dark blue, Cluster 1; red, Cluster 2. (B) Two clusters were supported with the highest Calinski-Harabasz (CH) pseudo F-statistic value, as the optimal number of clusters. (C) Boxplot comparison of the number of observed OTUs between Cluster 1 and Cluster 2. (D) Boxplot comparison of the Chao1 index between Cluster 1 and Cluster 2. **p < 0.01 based upon Mann-Whitney U-tests with Benjamini & Hochberg correction.

