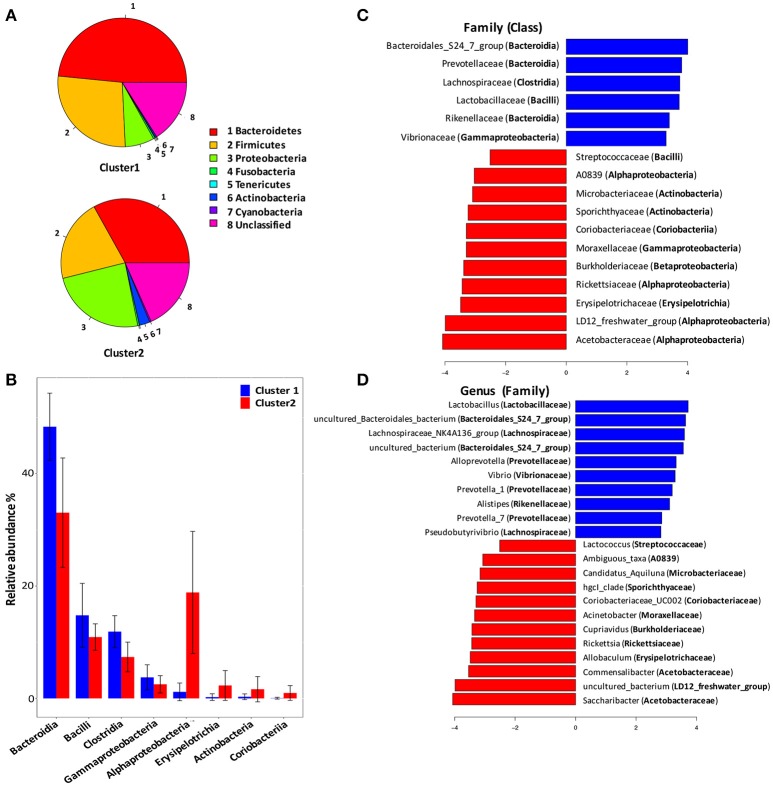
Figure 2.
Compositional analysis of ascitic microbial clusters. (A) Pie chart comparison of bacterial phyla represented in two clusters (upper: Cluster 1, lower: Cluster 2). (B) Histograms showing differentially enriched bacterial classes between Cluster 1 and Cluster 2. Blue histograms, Cluster 1; red histograms, Cluster 2. (C). LEfSe analysis revealed differentially enriched bacterial families associated either with Cluster 1 (blue) or Cluster 2 (red). (D) LEfSe analysis revealed differentially enriched bacterial genus associated either with Cluster 1 (blue) or Cluster 2 (red).

