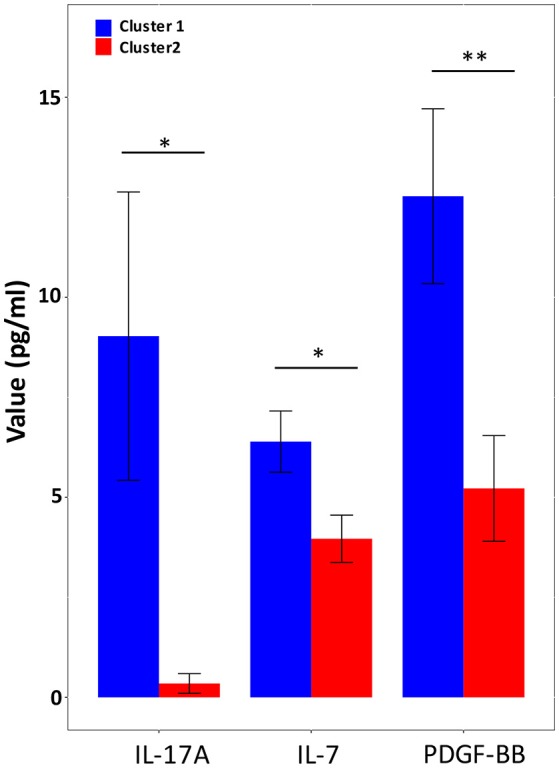
Figure 3.

Plasma cytokine levels with statistical difference between Cluster 1 and Cluster 2. Blue histograms, Cluster 1 (n = 68); red histograms, Cluster 2 (n = 10). Significance values are indicated: * p < 0.05 **p < 0.01 based upon Mann-Whitney U-tests with Benjamini & Hochberg correction.
