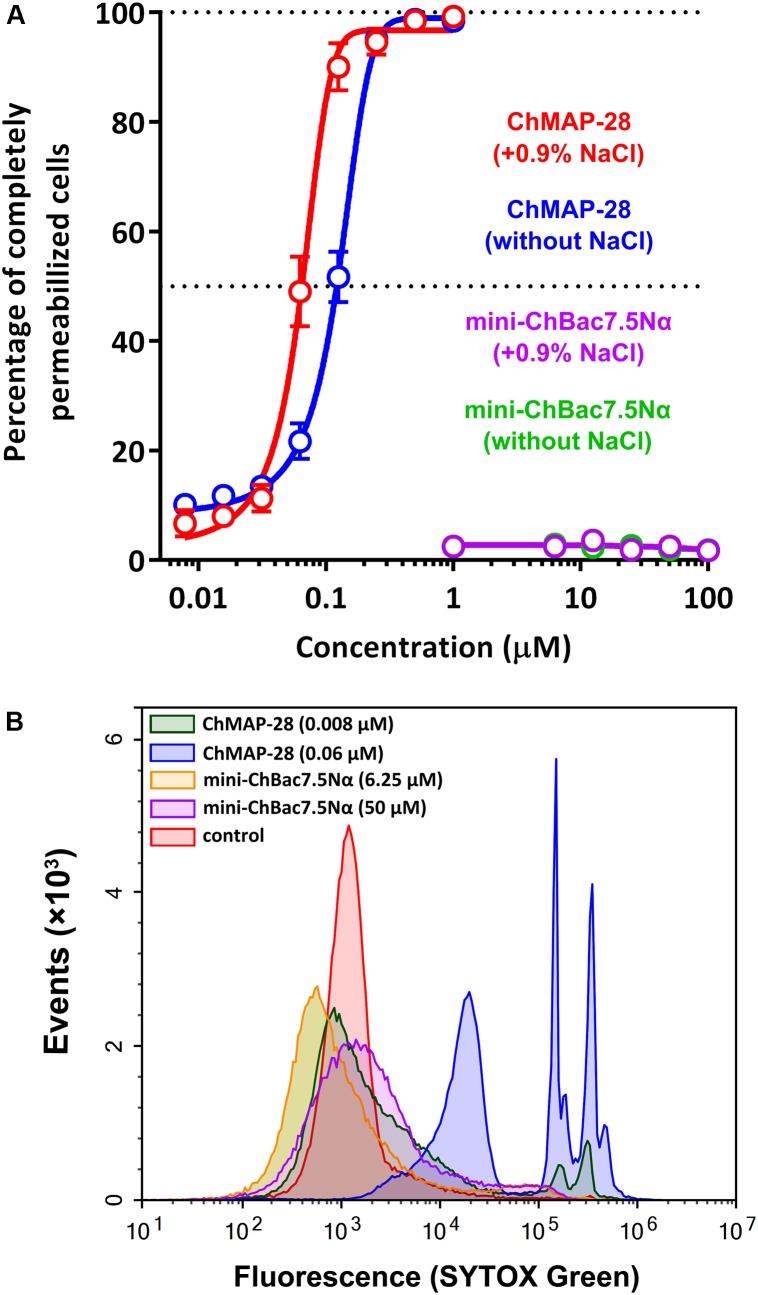
FIGURE 3.
Flow cytometry analysis of the SYTOX Green uptake in E. coli ML-35p cells after 60 min treatment with goat cathelicidins. (A) The graph showing the effect of the peptides at different concentrations. The experiment was performed in duplicate, with the plotted points representing the mean value ± SD. (B) Analysis of bacterial cell populations after treatment in the presence of 0.9% NaCl.

