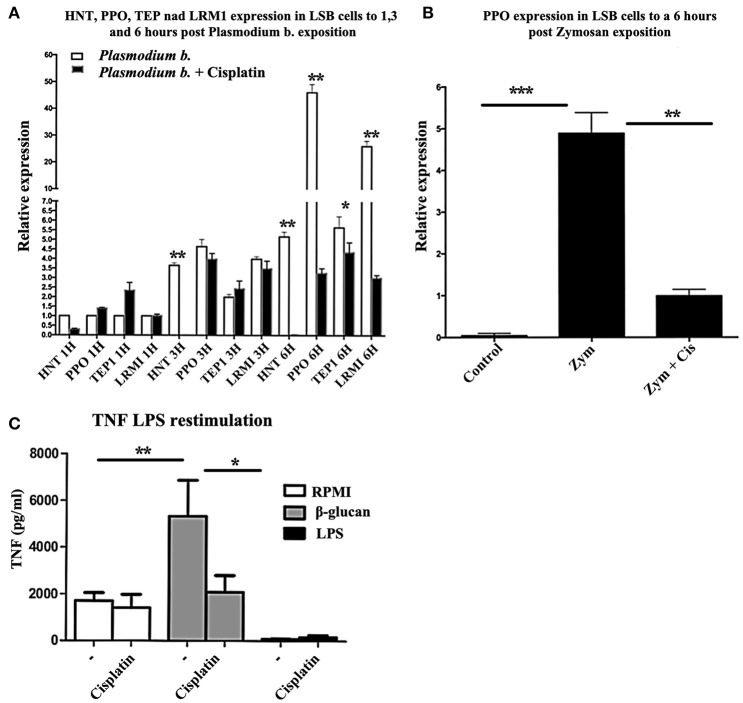
Figure 4.
(A) Relative expression levels (CT) of HNT, PPO1, TEP1, and LRIM1 in LSB cells at 1, 3, and 6 h of exposure to Plasmodium berghei or Plasmodium berghei + cisplatin. N = 3, Wilcoxon; *p < 0.05; **p < 0.01. The data are based on three experiments. (B) LSB cells were treated for 6 h with Zymosan alone or Zymosan + cisplatin and the relative expression of PPO was determined. N = 3, Wilcoxon; **p < 0.01; ***p < 0.001. Values are the mean of three experiments. (C) Human monocytes were incubated for 24 h in RPMI, β-glucan or LPS (the former being the control, the latter two the trained and tolerant cells, respectively). Afterwards, the cells were left for 5 days in RPMI medium with 10% human pooled serum with or without cisplatin. Then cells were re-stimulated for 24 h with 10 ng/ml LPS. The production of TNFα in the supernatant was quantified by ELISA. N = 6, Wilcoxon; *p < 0.05; **p < 0.01.

