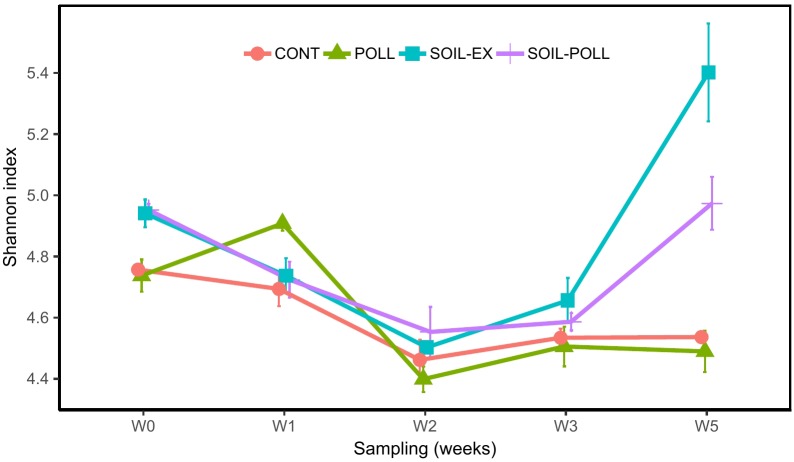
FIGURE 4.
Development of biodiversity in bacterial communities (Shannon’s diversity index) from the different treatments (CONT, control; POLL, pollutants addition; SOIL-EX, tDOM addition; SOIL–POLL, tDOM + pollutants addition) throughout the experiment. Error bars represent the standard deviation (n = 3).

