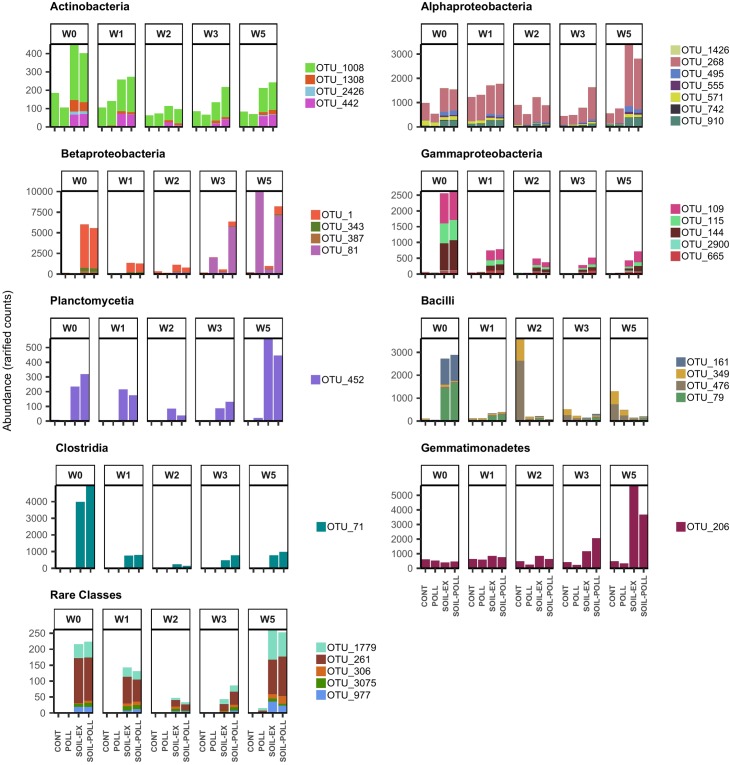
FIGURE 6.
Abundance (rarified counts) of OTUs from GLM model contributing to the significant differences observed between communities from different treatments and sampling times. The OTUs are classified according to their bacterial taxonomy at class level. Specific taxonomic classification corresponding to these OTUs is shown in Table 2.

